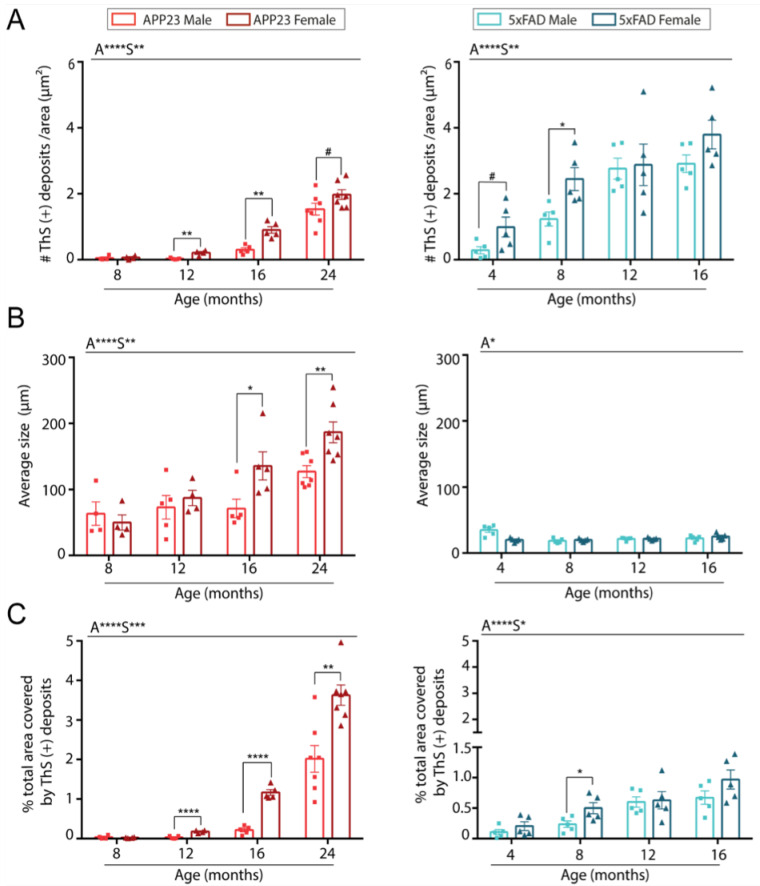
Figure 2.
Quantification of parenchymal Aβ burden in brains from male and female 5xFAD and APP23 mice at different ages. (A) Quantification of the number of ThS-positive deposits corrected by area. (B) Quantification of the average size of ThS-positive deposits. (C) Quantification of total area occupied by the deposits (%). n = 4–7/group. The effect of sex (S) and age (A) was evaluated in each subgroup of data. Statistical differences were analyzed among groups as indicated and represented as: # p < 0.1, * p < 0.05, ** p < 0.01, *** p < 0.001, **** p < 0.0001.

