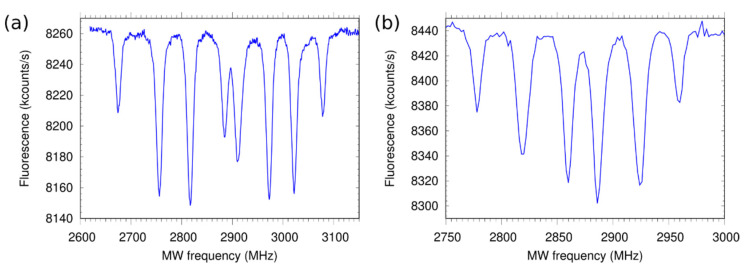
Figure 7.
ODMR spectra of the NV centers in the (a) [100] and (b) [111] samples. The applied magnetic field is B0 [100] = 36.5 G and B0 [111] = 32.5 G, respectively. The different contrast of the transitions is probably due to varying microwave field for different crystal orientations of the NVs. The bulk structures show similar ODMR spectra (data not shown).

