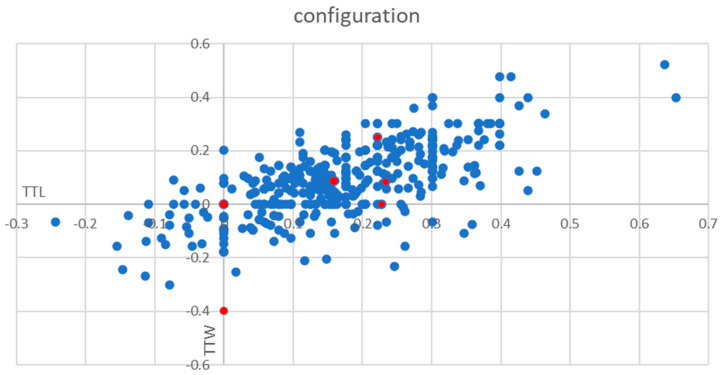
Figure 4.
Frequency of TTW nodules. The y-axis shows the log (transversal diameter/sagittal diameter) and x-axis the log (transversal diameter/longitudinal diameter) for each nodule. The lower ends of the y-axis and the x-axis are named TTW (taller-than-wide) and TTL (taller-than-long). Red points represent malignant nodules.

