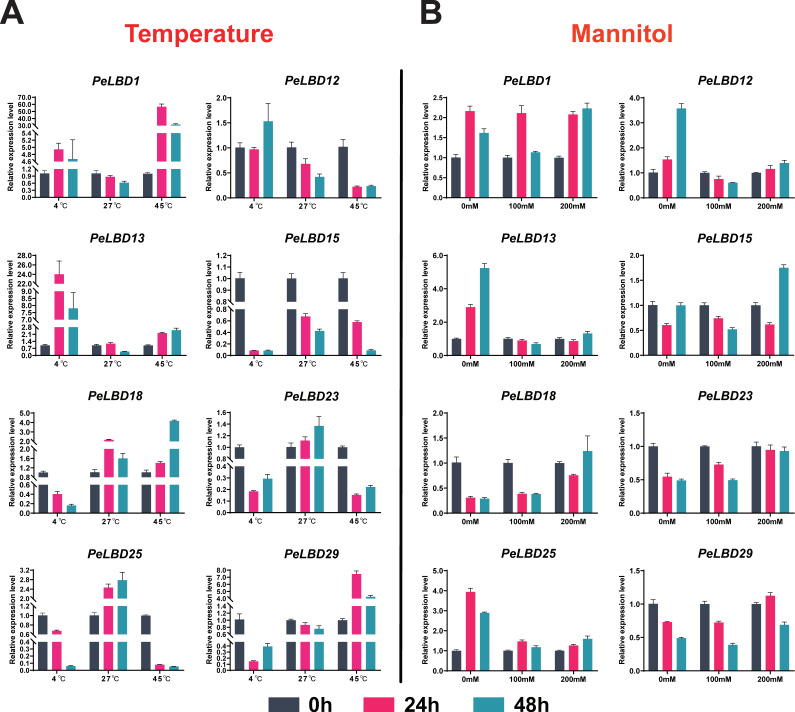
Figure 10.
qRT-PCR analysis of eight genes (PeLBD1, PeLBD12, PeLBD13, PeLBD15, PeLBD18, PeLBD23, PeLBD25 and PeLBD29) under (A) cold (4 °C), heat (45 °C) and (B) drought stress treatment. All experiments were performed independently at least three times. Error bars represent the standard deviation of three replicates.

