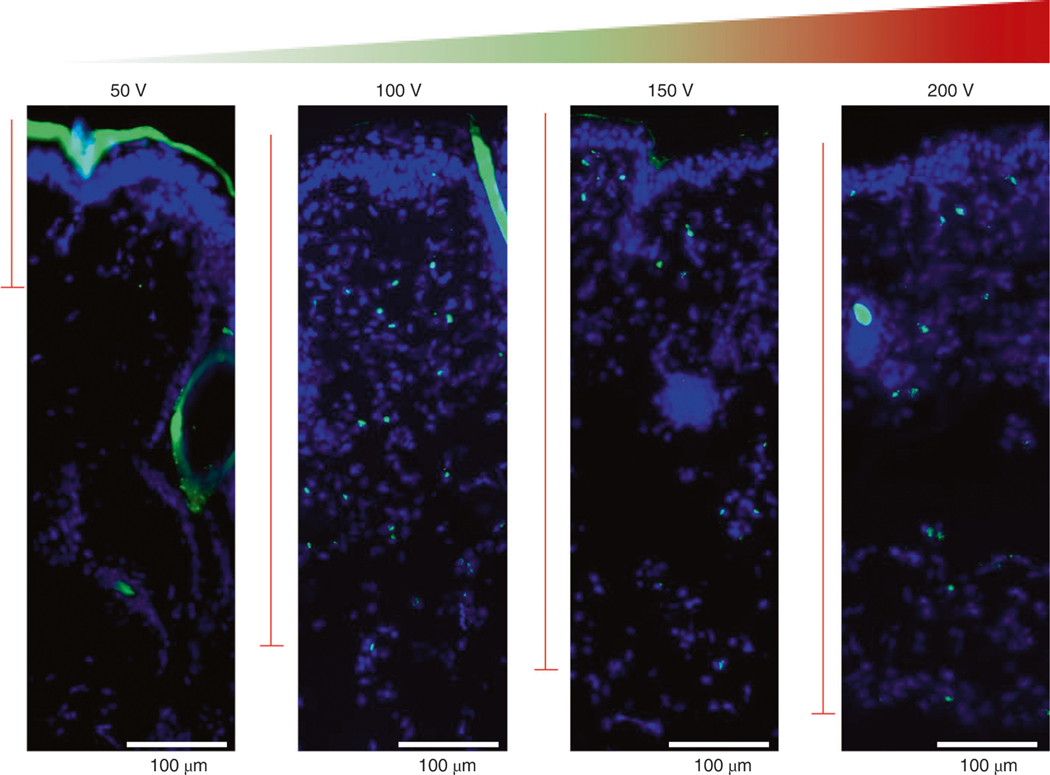
Fig. 12 |. Depth of cutaneous gene delivery as a function of applied voltage.
Representative fluorescent staining of dorsal murine skin after TNT to deliver FAM DNA (green) with Type I hollow-needle array at different voltages (50–200 V). The tissue sections were counter-stained with DAPI (blue). The sections were imaged using an AxioScan Z.1 (Zeiss) microscope.

