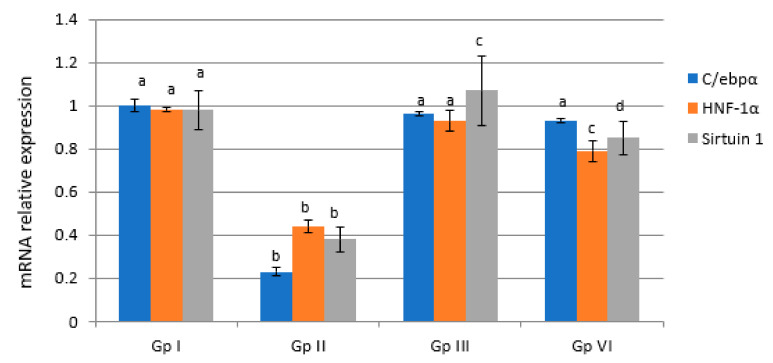
Figure 4.
Effect of MESC and silymarin on the expression levels of liver C/ebpα, HNF-1α, and sirtuin-1 genes in paracetamol-treated rats. Data are presented as fold increases with respect to control values, considering the normal control values equal to 1. Data followed by the same letter within the same parameter are not significantly different at p ≤ 0.05.

