
FIGURE 4.
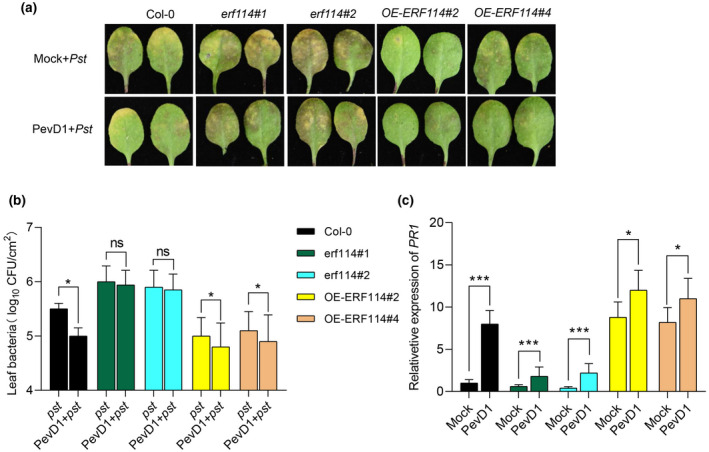
ERF114‐mediated PevD1‐induced disease resistance. (a) The disease symptoms of Pseudomonas syringae pv. tomato (Pst) DC3000 in Col‐0, erf114#1, erf114#2, OE‐ERF114#2, and OE‐ERF114#4 leaves. The photograph was taken at 48 h after Pst DC3000 inoculation. (b) Bacteria in PevD1‐infiltrated leaves were measured by colony counting. Col‐0, erf114 and OE‐ERF114 leaves were infiltrated with Tris buffer (Mock) or PevD1 then inoculated with Pst DC3000 at 24 h postinfiltration (hpi). Bacterial titres were counted at 48 hpi. Data from three separate experiments are shown (mean ± SD, n = 6). *p < 0.05, ns, not significant, one‐way analysis of variance (ANOVA). (c) Relative expression level of PR1 in 4‐week‐old wild‐type (Col‐0), erf114, and OE‐ERF114 leaves at 12 hpi. UBC21 was used as the internal control. The bars were calculated based on three independent experiments. The values are mean ± SD (n = 3). *p < 0.05, ***p < 0.001, one‐way ANOVA