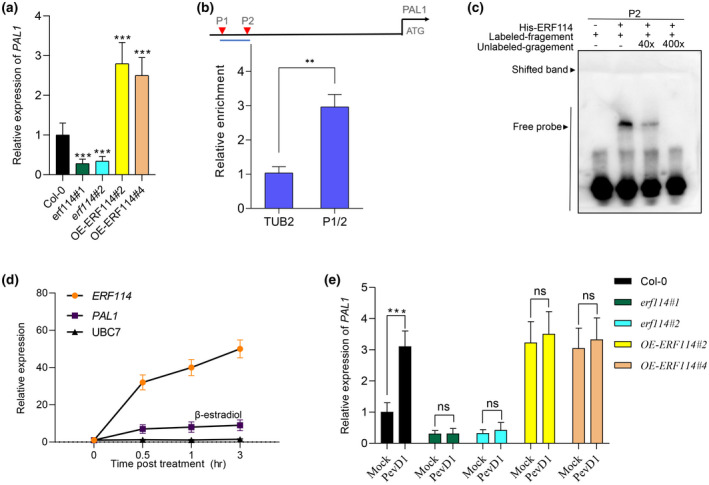
FIGURE 5.

ERF114 binds to the promoter of PAL1 and activates PAL1 expression. (a) Relative expression level of PAL1 in erf114 and OE‐ERF114 leaves compared to wild type Col‐0. UBC21 was used as the internal control. The bars were calculated based on three independent experiments. The values are mean ± SD (n = 3). ***p < 0.001, one‐way analysis of variance (ANOVA). (b) Schematic diagrams of ERF114‐binding cis‐elements in the promoter region of PAL1 (P1 and P2). ATG represents the translational start codon. The lines below the binding sites indicate the sequences detected in the chromatin immunoprecipitation‐quantitative PCR (ChIP‐qPCR) assay. An anti‐GFP monoclonal antibody was used for DNA immunoprecipitation from 4‐week‐old 35S:GFP‐ERF114#2 transgenic plants. The relative enrichment of ERF114 binding to the PAL1 promoter was normalized to TUBULIN2 (TUB2). Each experiment was repeated at least three times with similar results. The values are mean ± SD (n = 3). **p < 0.01, one‐way ANOVA. (c) Electrophoretic mobility shift assays (EMSA) for the binding of ERF114 to the PAL1 promoter in vitro. A biotin‐labelled probe was used for the EMSA experiments and unlabelled fragments were used as competitors. The “+” and “−” symbols represent the presence and absence of components, respectively. Band shift is indicated by an arrow. (d) ERF114 induces the transcript of PAL1. Reverse transcription‐quantitative PCR analysis of ERF114, PAL1, and UBC7 expression in the iERF114 plants treated with 20 μM β‐oestradiol for the indicated time points. The bars were calculated based on three independent experiments. The values are mean ± SD (n = 3). (e) Relative expression level of PAL1 in PevD1‐induced wild‐type Col‐0, erf114, and OE‐ERF114 leaves at 24 h postinoculation (hpi). UBC21 was used as the internal control. Relative expression is indicated compared to the transcript level of UBC21. The bars were calculated based on three independent experiments. The values are mean ± SD (n = 3). ns, not significant. ***p < 0.001, one‐way ANOVA
