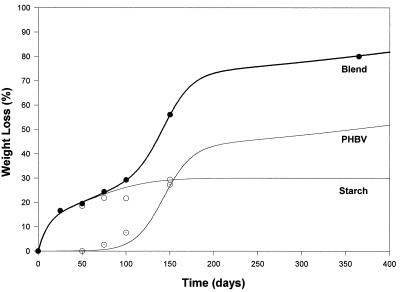
FIG. 4.
Computed polymer weight loss profiles (curves) for a 30% starch–70% PHBV blend. Data are from station 2. Symbols: •, total weight loss for test specimens; ○ and ⊙, experimental weight loss for individual starch (○) and PHBV (⊙) polymers obtained by dichloromethane extraction of test specimens, plotted after the starch and PHBV curves were determined with the mathematical model.

