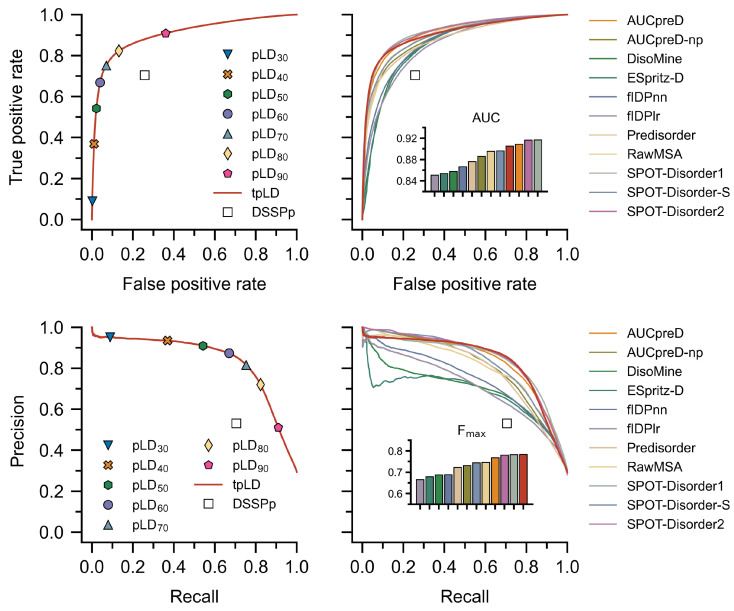
Figure 1.
Receiver operating characteristic (ROC) curves (top) and precision–recall (bottom) are depicted for various predictors calculated per residue on the DisProt-PDB dataset. Note that a ROC curve captures the probability of true and false positives at all thresholds, where an ideal predictor will have an area under the curve (AUC) equal to 1. Further note that a precision–recall curve captures the trade-off between precision and recall; again, in the ideal case the harmonic mean of the precision and recall (F) will be equal to 1; bar colors correspond to the legend, red denotes tpLD. In all cases the tpLD (Equation (1)) and various discrete pLD predictors are indicated alongside DSSPp. The tpLD predictor resulted in one of the highest AUC values and the highest F on the DisProt-PDB dataset. pLDDT is abbreviated as pLD for plotting purposes.

