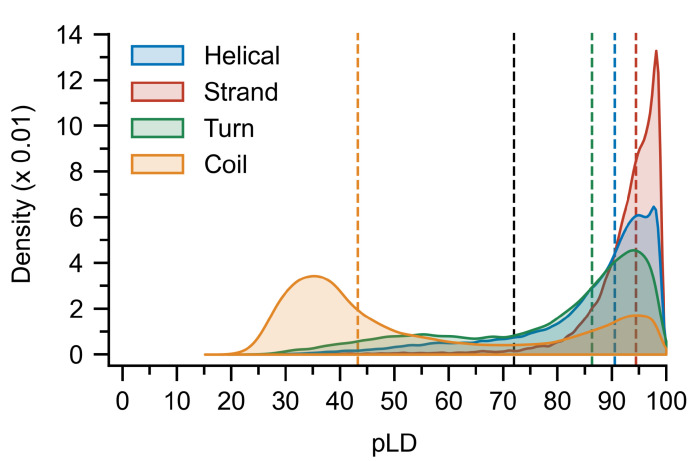
Figure 4.
Distribution of pLDDT values per residue calculated for each secondary structure class. Bin-widths were set at 0.5 and bootstrapping, that is, sampling with replacement, was used to compute the distributions and mean values (colored vertical dashed lines; black dashed line represents pLD) with 10,000 samples of size 500. A bimodal distribution is evident for the coil structures, and while strand, helical, and turn regions are on average assigned to high pLDDT values, residues belonging to each can sample much lower values. pLDDT is abbreviated pLD for plotting purposes.

