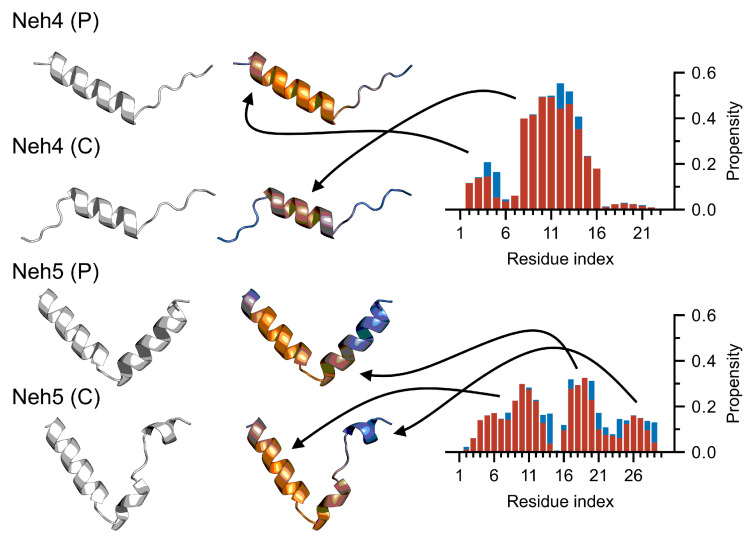
Figure 6.
AF2 predicted structures correlate with simulated secondary structure. We consider the peptide (i.e., Neh4/5 (P)) and construct (i.e., Neh4/5 (C)) structures predicted from AF2, without a colormap and with a pLDDT colormap scaled between 70 and 100 (i.e., blue implies and orange implies ). Note how the coloring of the structures provides non-trivial insights that are undetectable without it. These are depicted alongside the average secondary structure computed using both the ff99SB*-ILDNP and ff99SB-disp simulations (red = -helix, -helix or -helix; blue = -strand or -bridge). Note that arrows indicate corresponding regions between AF2 structures (left) and structural propensities computed from MD simulations (right).

