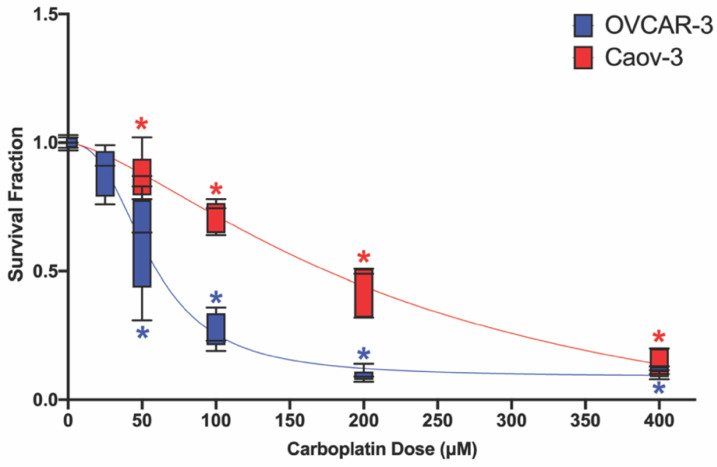
Figure 4.
Dose–response to carboplatin in OVCAR-3 and Caov-3 cells. Dose-dependent reduction in survival fraction in OVCAR-3 (blue) and Caov-3 (red) cells following incubation with 0–400 μM carboplatin for 48 h. Data are shown as mean ± SD expressed as a percentage of the vehicle control (vehicle + 0 μM carboplatin); n = 3 independent experiments in duplicate. Curves were fitted using nonlinear regression analysis. Significant differences between treatment group versus vehicle control are denoted by * (p < 0.05).

