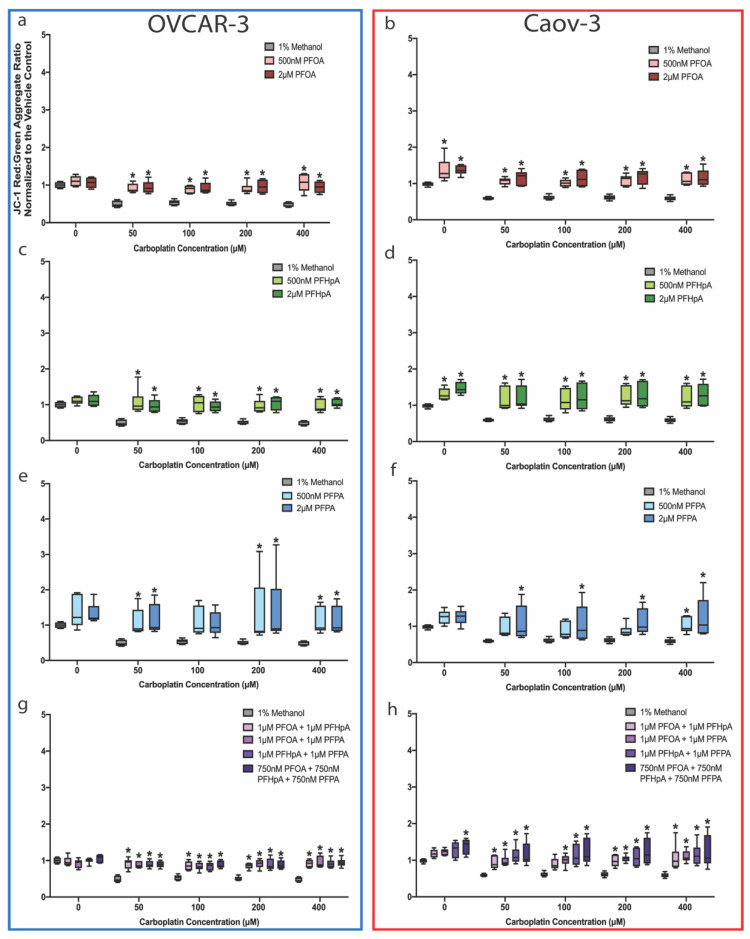
Figure 8.
ΔΨm increases in OVCAR-3 and Caov-3 cells exposed to PFAS or PFAS mixtures then treated with carboplatin. ΔΨm increased compared to the vehicle control in OVCAR-3 (blue box) and Caov-3 (red box) cells after exposure to (a,b) PFOA, (c,d) PFHpA, (e,f) PFPA, or (g,h) PFAS mixtures at nearly all carboplatin concentrations examined (mean ± SD expressed as a percentage of the vehicle control; n = 3 independent experiments in duplicate). Significant differences between treatment group versus vehicle control are denoted by * (p < 0.05).

