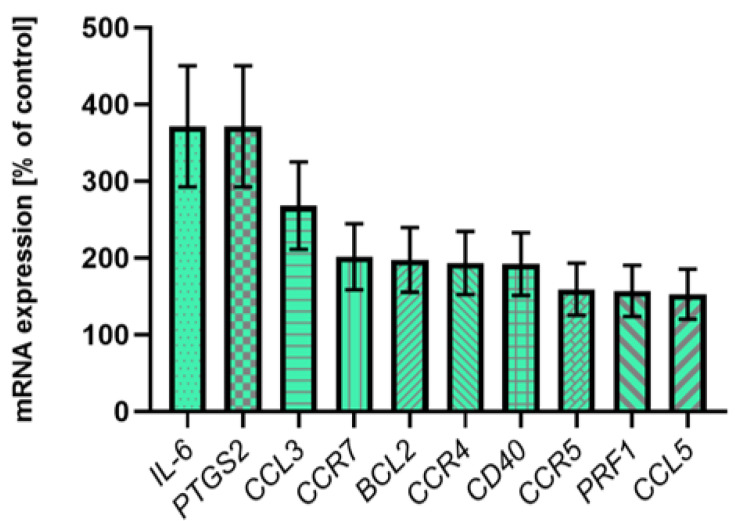
Figure 4.
Presentation of the most abundantly expressed genes in screening analysis. Transcripts were distinguished based on their significant expression—over 150% of the control value. All gene expression results were calculated using the 2−ΔCt equation (according to the reference gene encoding 18S rRNA), n = 12.

