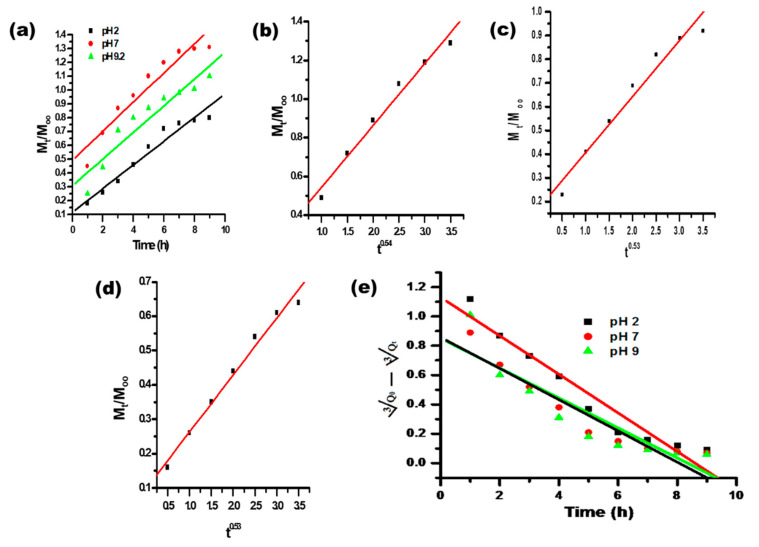
Figure 9.
(a) Plot of Mt/M∞ vs. time; (b) plots of Mt/M∞ vs. tn (n = 0.54) at pH 7; (c) plots of Mt/M∞ vs. tn (n = 0.53) at pH 2; (d) plots of Mt/M∞ vs. tn (n = 0.53) at pH 9.2; and (e) plot of root cube of √Qo − √Qt vs. time for the release of itraconazole from the synthesized CH-Ag bionanocomposite.

