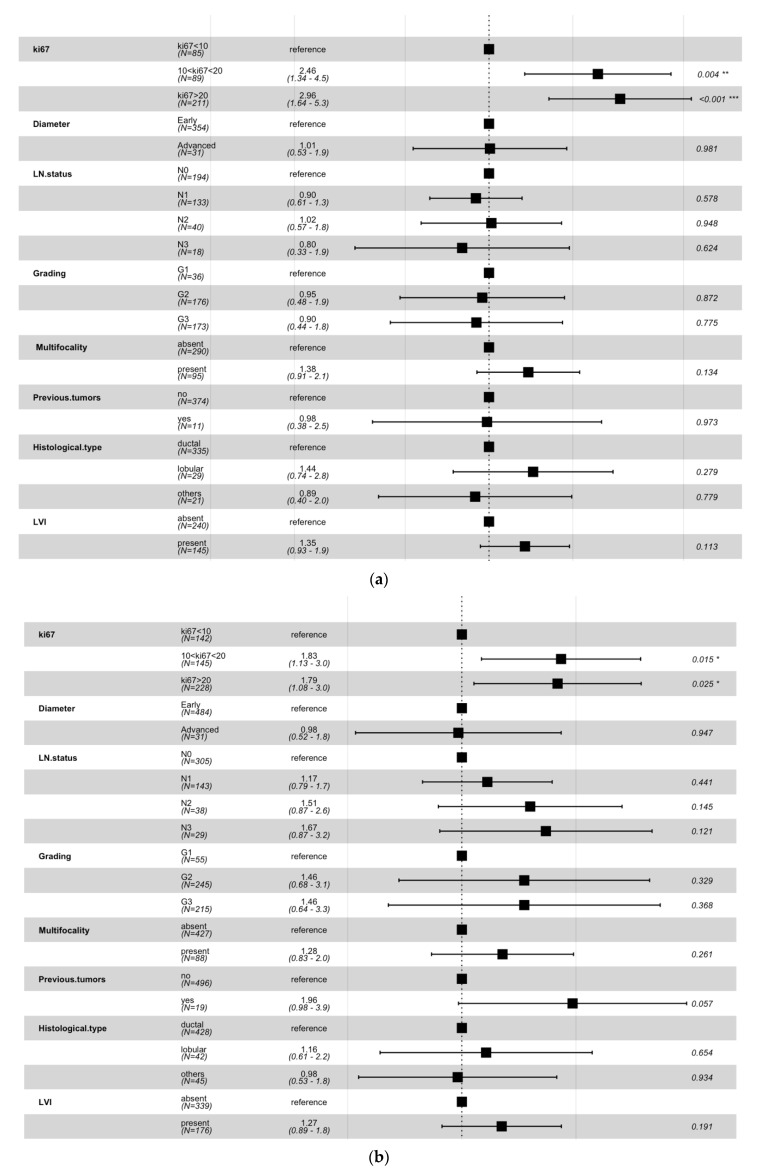
Figure 4.
Multivariate analysis performed on patients under 50 years old (a) and over 50 years old (b) by means of the Cox proportional-hazard model. For each involved variable, the hazard rates (third column) and the p-values (last column) were computed by the model with respect to a specific reference value. * p-value < 0.05, ** p-value < 0.01, *** p-value < 0.001.

