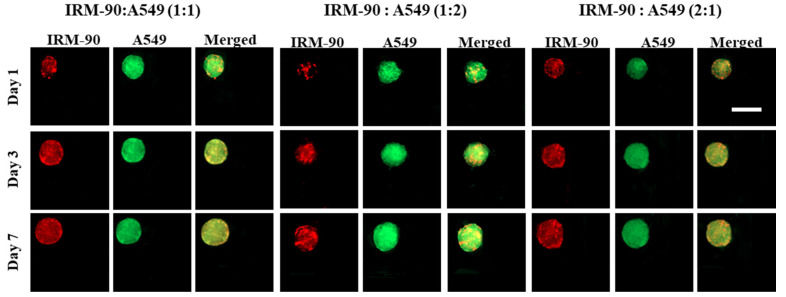
Figure 5.
Image of co-culture A549 and IRM-90 cells with different ratios between the two cell lines. The total initial cell concentration was 1 × 10⁶ cells/mL for all experiments. Our observations demonstrated that there were no remarkable differences in terms of the growth pattern including the size and the shape of the spheroids by varying the ratio between tumor and stromal cells. The red color is due to red-fluorescent protein (RFP) in IRM-90 cells and the green color is due to being fluorescently labeled with cell-labeling solution Vybrant Dio V22886 for A549 cells. Scale bars: 200 μm.

