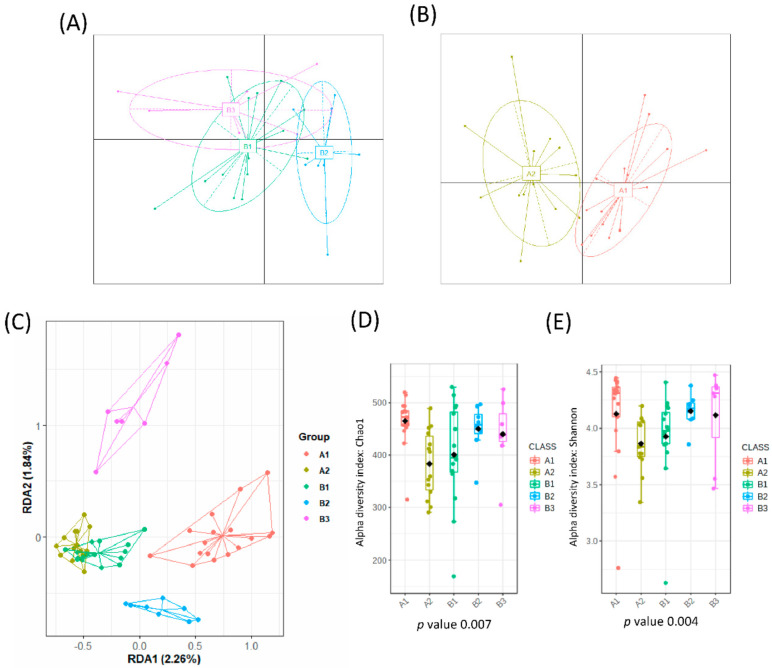
Figure 1.
Microbial clusters and representative microbial taxa at the genus level. The partitioning around medoid method showed that volunteers were clustered at baseline into 3 groups (A) and into 2 groups after intervention (B) as reported in the Principal Coordinate Analysis (PCoA). (C) Multivariate redundancy discriminant analysis (RDA) showed distinct microbial communities for each group with the alpha diversity indexes: (D) richness (Chao1 index) and (E) diversity (Shannon index) depending on each cluster. Schemes follow the same formatting.

