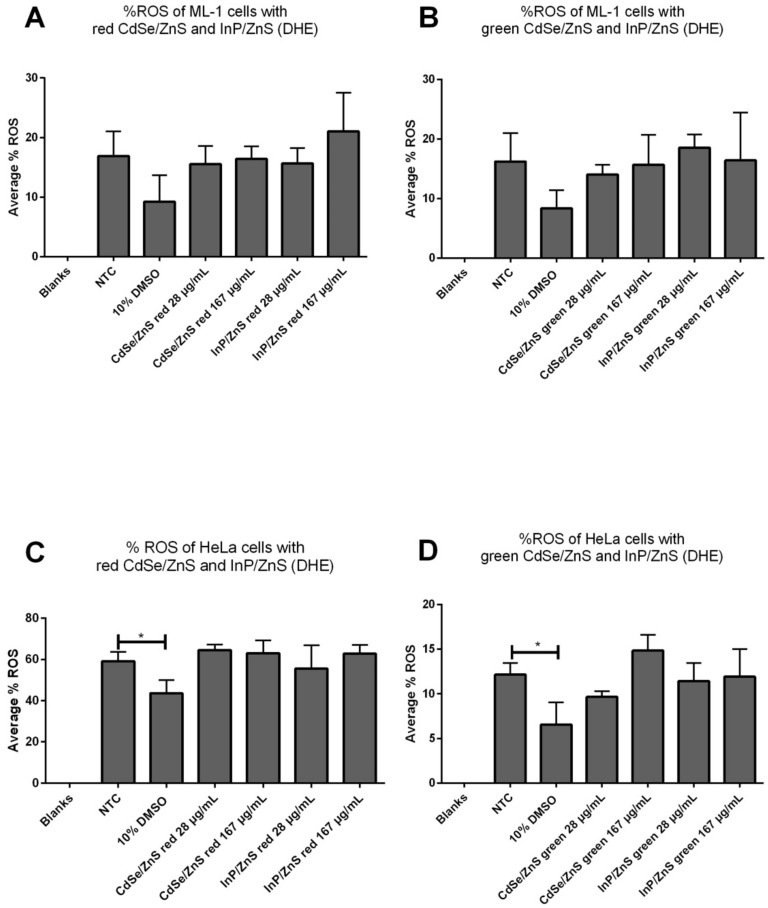
Figure 2.
ROS measurements with DHE at varied CdSe/ZnS and InP/ZnS QD concentrations. (A) ML-1 cells were treated with 28 µg/mL and 167 µg/mL of red CdSe/ZnS and InP/ZnS QDs for 24 h. (B) ML-1 cells were treated with 28 µg/mL and 167 µg/mL of green CdSe/ZnS and InP/ZnS QDs for 24 h. (C) HeLa cells were treated with 28 µg/mL and 167 µg/mL of red CdSe/ZnS and InP/ZnS QDs for 24 h. (D) HeLa cells were treated with 28 µg/mL and 167 µg/mL of green CdSe/ZnS and InP/ZnS QDs for 24 h. Statistically significant results are indicated based on p-values: * = p < 0.05.

