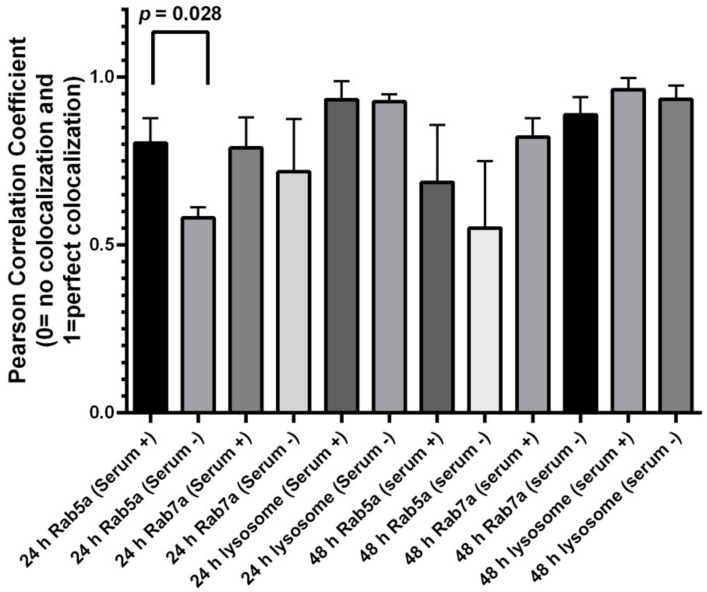
Figure 8.
Colocalization assay depicting the level of colocalization between CdSe/ZnS QD and fluorescence organelle markers in HeLa cell culture. Graph bars represent the results of colocalization analysis using the JACoP plugin from ImageJ using Pearson’s correlation coefficient. Mean Pearson coefficient and standard deviation values for levels of colocalization between QDs and fluorescent organelle markers are indicated in the graph. The mean Pearson coefficient value for the level of colocalization between QDs and the early endosome in the culture with serum was statistically significantly higher than that for cells grown in the culture lacking serum (p = 0.028, via Prism GraphPad Dunnett test).

