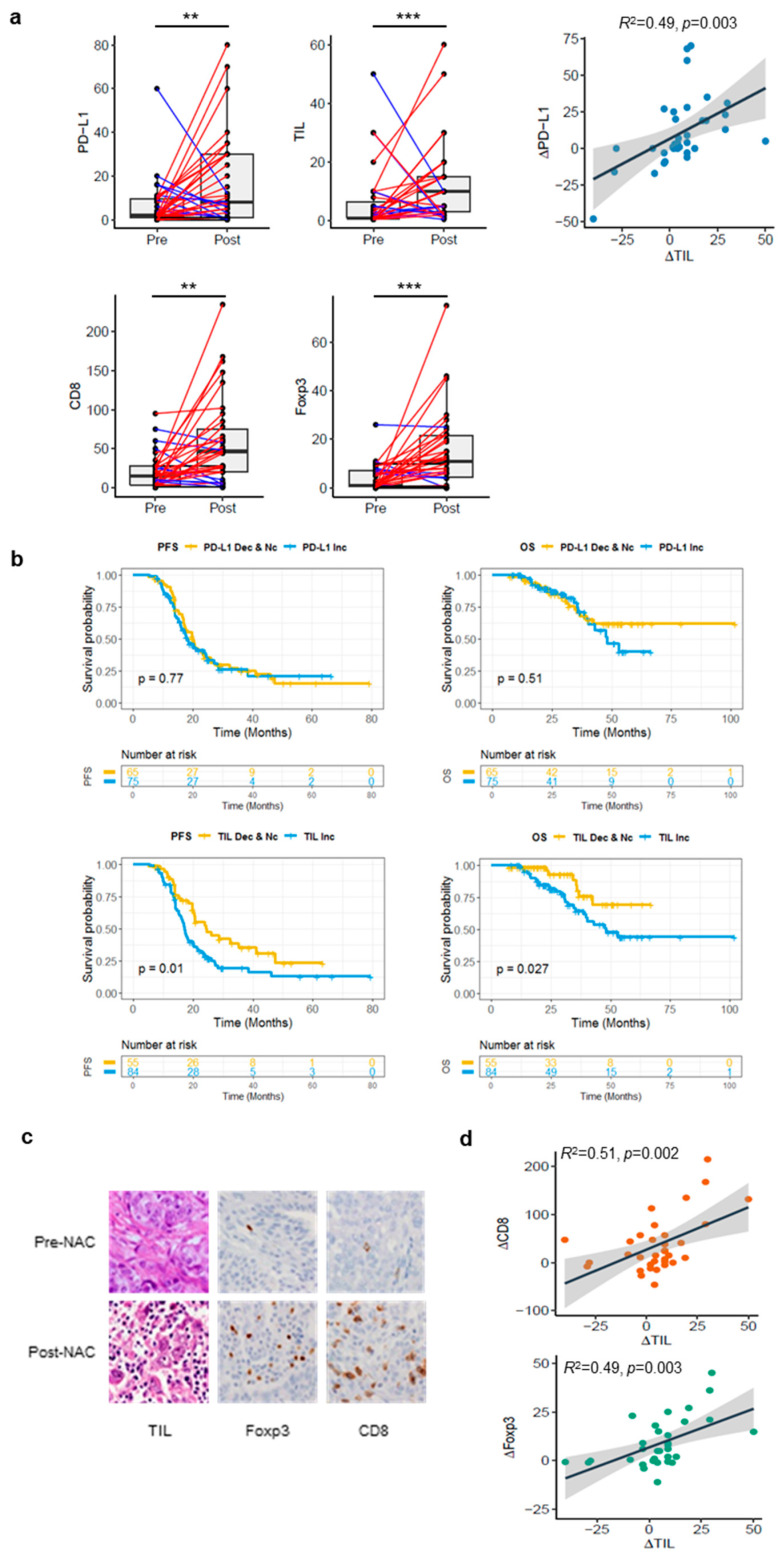
Figure 3.
Comparison of changes in the tumor immune microenvironment between matched samples. (a) Comparison of PD-L1 and TIL densities in pre- and post-NAC samples based on immunohistochemical staining. Scatterplots with linear regression line and shaded 95% confidence region between PD-L1 and TIL changes. (b) Prognostic value of PD-L1 and TIL density change as indicated by the Kaplan–Meier curves of PFS and OS. (c) Representative images of pre- and post-NAC TILs, Foxp3 and CD8 immunostaining (original magnification; 40× objective). (d) Scatterplots with linear regression line and shaded 95% confidence region between TIL level and CD8, Foxp3 staining intensity. ** p < 0.01, *** p < 0.001.

