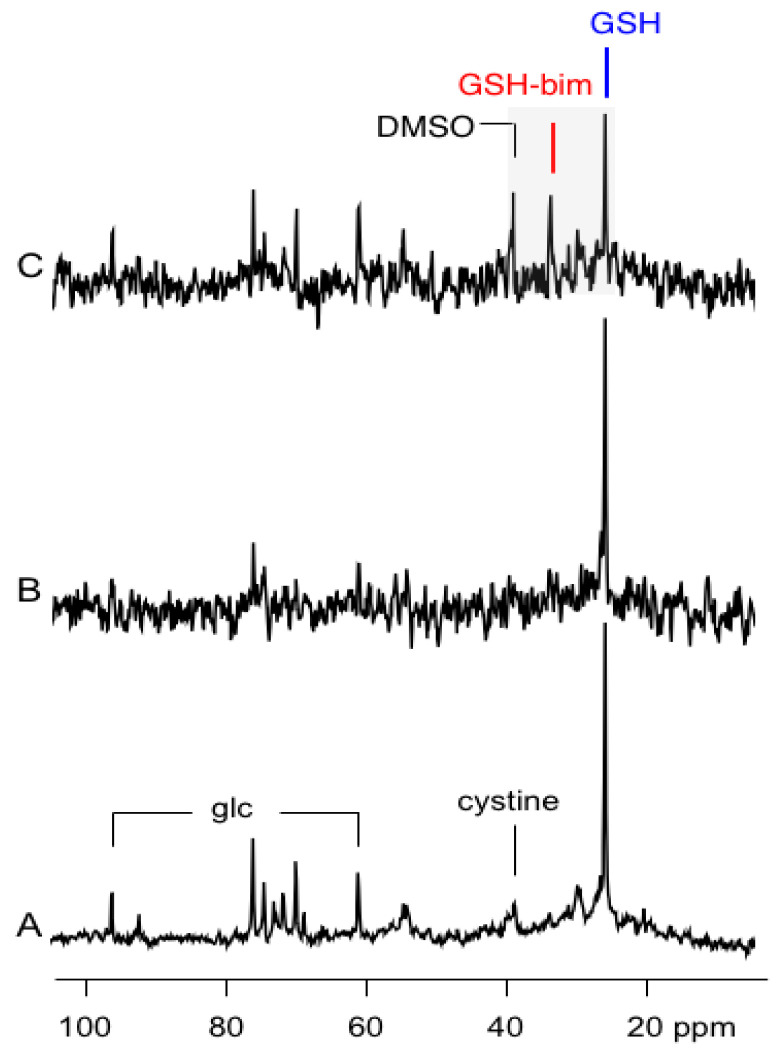
Figure 3.
(A) A portion of the 13C NMR spectrum of perfused JM-1 cells 13.5 h after the switch over to [3,3′-13C2]-cystine. The data is obtained after a 30 min scan. The resonances due to glucose (glc) and cystine in the media are indicated. (B) The same cells after 13.5 h after switch over to [3,3′-13C2]-cystine obtained after a 1.2 min scan. (C) The same cells 9.6 min after adding a solution of mBBr in DMSO to the perfusate. The shaded region shows the three resonances of interest between 25–40 ppm of the 13C-spectrum.

