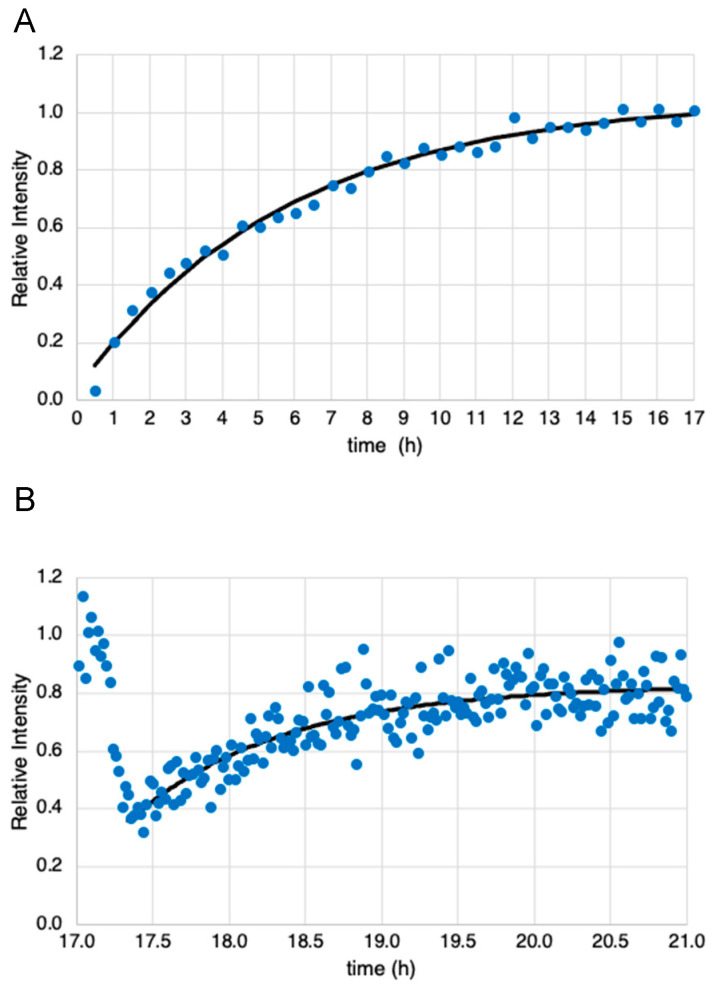
Figure 5.
(A) Plot of the time course of the integrated intensity of 13C-GSH resonance collected in 30 min time intervals after switching to growth media containing [3,3′-13C2]-cystine. This was obtained from data similar to that in Figure 2D. The black line shows an exponential fit to the curve with rate constant k = 0.172 h−1. (B) Plot of the time course of the integrated intensity of the 13C-GSH resonance collected in 1.2 min time intervals just prior to, during and after the addition of mBBr to the perfusate. This was obtained from data similar to that in Figure 4. The black line shows an exponential fit to the portion of the data that represents glutathione resynthesis with a rate constant k = 1.04 h−1.

