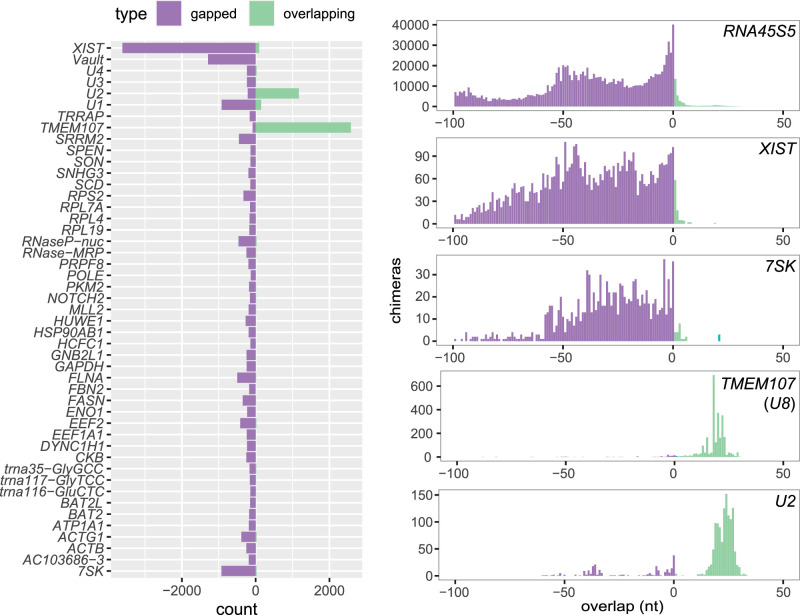
Figure 3.
Distribution of overlap scores in individual genes in PARIS experiment. Counts of gapped and ungapped chimeras (purple) and overlapping chimeras (green) in individual genes in PARIS data from human HEK293 cells (Lu et al. 2016) (left), and distribution of the overlap value L in selected genes.

