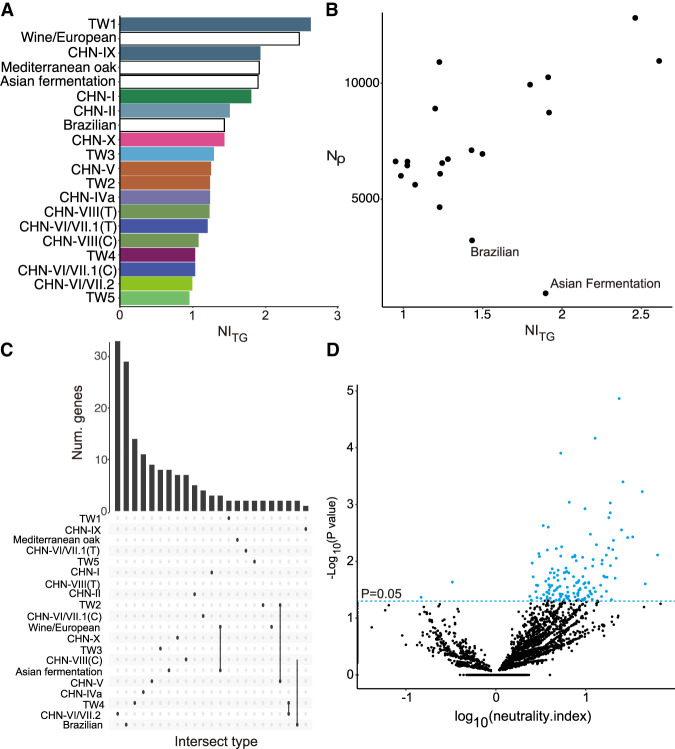
Figure 5.
Population genomics across lineages. (A) NITG estimates in natural and two domesticated lineages. (B) Relationship between NITG and Nρ across natural lineages. (C) Lineage-specific and shared genes with NI < 1. (D) ΝΙ from the McDonald–Kreitman test for each gene in the TW3 lineage with S. paradoxus as the outgroup. Genes that were significantly different from NI = 0 were highlighted in blue.

