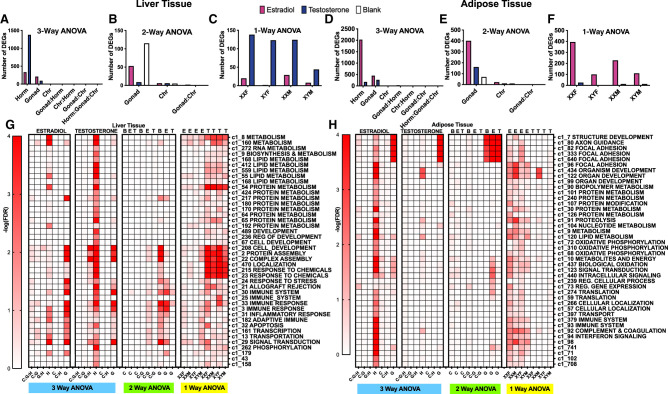
Figure 2.
Bar graphs (A–F) and heatmaps (G,H) representing the number of DEGs for each sex-biasing factor and differential coexpression modules from a three-way, two-way, and one-way ANOVA, respectively. Each bar graph represents the number of DEGs based on each specific statistical analysis at FDR < 0.05, in liver (A–C) and inguinal adipose tissue (D–F). (A,D) Results from three-way ANOVAs run separately in testosterone versus blank groups, and estradiol versus blank groups to examine hormone, gonad, and sex chromosome effects as well as the interaction terms. Pink bars indicate estradiol versus blank; blue bars indicate testosterone versus blank. (B,E) Results from two-way ANOVAs with factors of gonadal sex and sex chromosomes as well as the interaction term, run separately on data from testosterone (T), estradiol (E), and blank (B) treatment groups. Colors represent the hormonal treatment condition (testosterone groups blue, estradiol groups pink, and blank groups white). (C,F) Results from one-way ANOVA testing effects of hormonal treatments (vs. blank) in each of the four genotypes for liver and inguinal adipose tissue. Colors show effects of testosterone versus blank (blue) or estradiol versus blank (pink) in each of the four genotypes. (Horm) hormone, (Chr) sex chromosome, (M) testes/Sry present, (F) ovaries present, no Sry. (G) Coexpression module heatmap for liver. (H) Coexpression module heatmap for adipose tissue. Each heatmap shows results from one-way, two-way, and three-way ANOVAs for hormone (H), chromosome (C), and gonad (G) when treated with testosterone (T), estradiol (E), and blank (B). Interaction terms among H, C, and G were also tested. For instance, C:G:H indicates the interaction term among the three factors in three-way ANOVA. The influence of each sex-biasing factor on the coexpression modules was assessed using the first principal component of each module to represent the expression of that module, followed by three-way, two-way, one-way ANOVAs to identify differential modules (DMs) at FDR < 0.05 that are influenced by the various sex-biasing factors. Each module was annotated with canonical pathways from GO and KEGG. Modules without pathway annotations did not show significant enrichment for genes in any pathways tested. Colors correspond to the statistical significance of the effects of sex factors on modules in the form of −log10(FDR).

