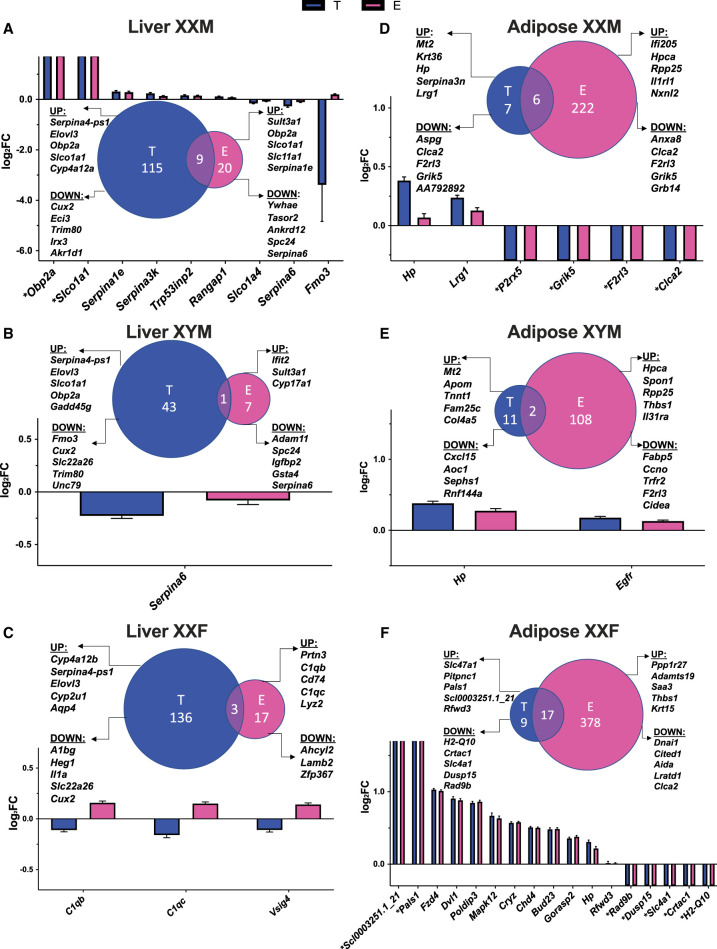
Figure 3.
Venn diagrams of DEG comparisons and bar graphs of overlapping DEGs between estradiol (E vs. blank, abbreviated as E) and testosterone (T vs. blank, abbreviated as T) treatment for each genotype in liver and adipose. (A) Liver XXM. (B) Liver XYM. (C) Liver XXF. (D) Adipose XXM. (E) Adipose XYM. (F) Adipose XXF. The bar graphs focused on the DEGs that passed an FDR < 0.05 and were overlapping between testosterone and estradiol treatment for each genotype and tissue. To understand the effects of each hormone, we plotted the log2 fold change (log2FC) of the hormonal effects. The Venn diagrams showcase comparison of DEGs of T effect versus E effect, as well as the top five up- and down-regulated genes for T or E in liver or adipose tissue for each genotype. There was no statistically significant overlap between any comparisons in the Venn diagrams. (*) Genes that are not expressed in one of the comparison groups and thus have infinite log2FC values.

