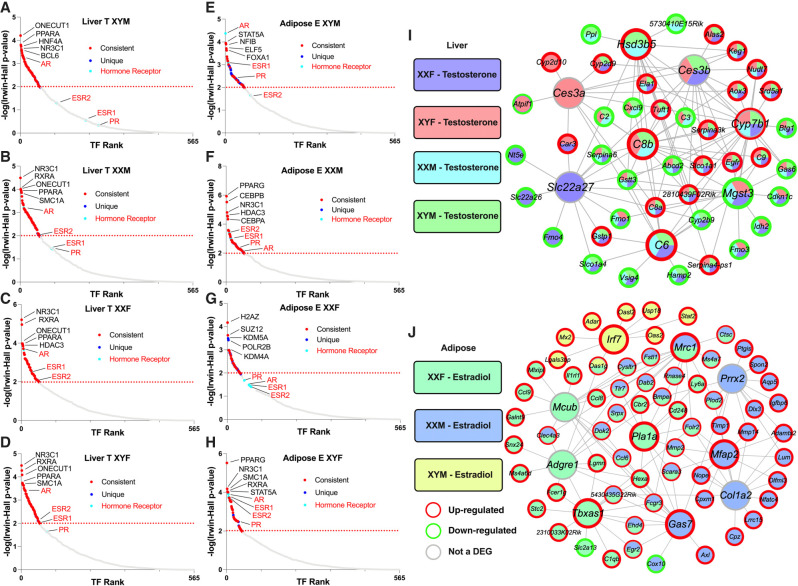
Figure 4.
Transcription factor analysis (A–H) and key driver analysis (I,J) of DEGs informed by estradiol and testosterone treatment in liver and adipose. (A–D) TF analysis for liver. (E–H) TF analysis for adipose. For the TF network, we used DEGs (FDR < 0.05) from our 1WA for testosterone and estradiol treatment analysis using the BART tool, in which a TF was considered significant by an Irwin–Hall P < 0.01 analogous to −log10(P-value) = 2. Red dots signify the TF is present in at least one other genotype and the blue dots signify if the TF is only present in the given genotype. Turquoise dots and red font denote a hormonal receptor relevant to testosterone and estradiol. Labeled TFs showcase the top five by rank and additional hormonal receptors. (I) Liver gene regulatory network (GRN). (J) Adipose GRN. For GRN construction, we overlaid DEGs (FDR < 0.05) from our post hoc 1WA for testosterone and estradiol treatment onto our previously built adipose and liver Bayesian networks utilizing a KDA analysis from the Mergeomics package. We visualized the top five KDs for the testosterone or estradiol DEGs from each genotype group. KDs are labeled as larger nodes and DEGs as smaller nodes. Direction of DEGs is annotated with red or green borders for up-regulation or down-regulation, respectively.

