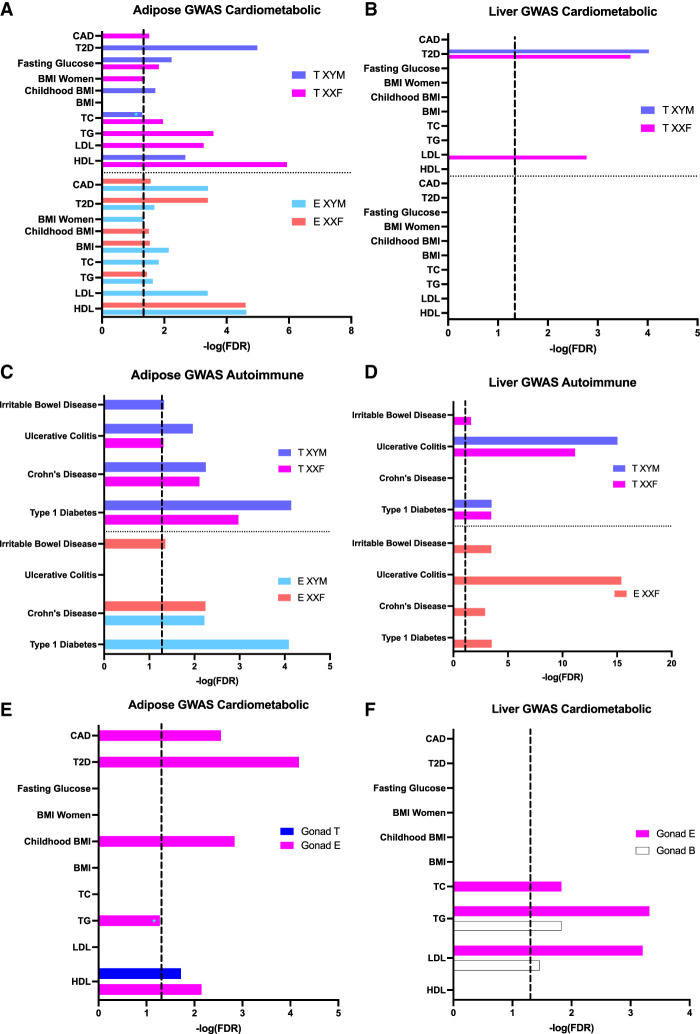
Figure 5.
Bar graphs showing enrichment of the hormone DEGs (A–D) and gonadal DEGs (E,F) for known cardiometabolic and autoimmune diseases based on MSEA analysis. The cardiometabolic category included coronary artery disease (CAD), type 2 diabetes (T2D), fasting glucose level, BMI in women, BMI during childhood, BMI, total cholesterol (TC), triglyceride (TG), low-density lipoprotein (LDL) cholesterol, and high-density lipoprotein (HDL) cholesterol (A,B). The autoimmune category included irritable bowel disease (IBD), ulcerative colitis (UC), Crohn's disease (CD), and type 1 diabetes (T1D) (C,D). (A) Association of adipose testosterone (T) and estradiol (E) DEGs with cardiometabolic diseases/traits. (B) Association of liver T and E DEGs with cardiometabolic diseases/traits. (C) Association of adipose T and E DEGs with autoimmune diseases. (D) Association of liver T and E DEGs with autoimmune diseases. (E) Association of adipose gonadal DEGs with cardiometabolic diseases/traits. (F) Association of liver gonadal DEGs for cardiometabolic diseases/traits. (A–D) Hormone DEGs at an FDR < 0.05 derived from the post hoc one-way ANOVA were tested against genetic association signals with cardiometabolic and autoimmune diseases and traits. (E,F) Gonadal DEGs at an FDR < 0.05 from two-way ANOVA were tested against genetic association signals with cardiometabolic diseases. Dotted line signifies FDR < 0.05; (*) enrichment minimally below the FDR < 0.05 cutoff.

