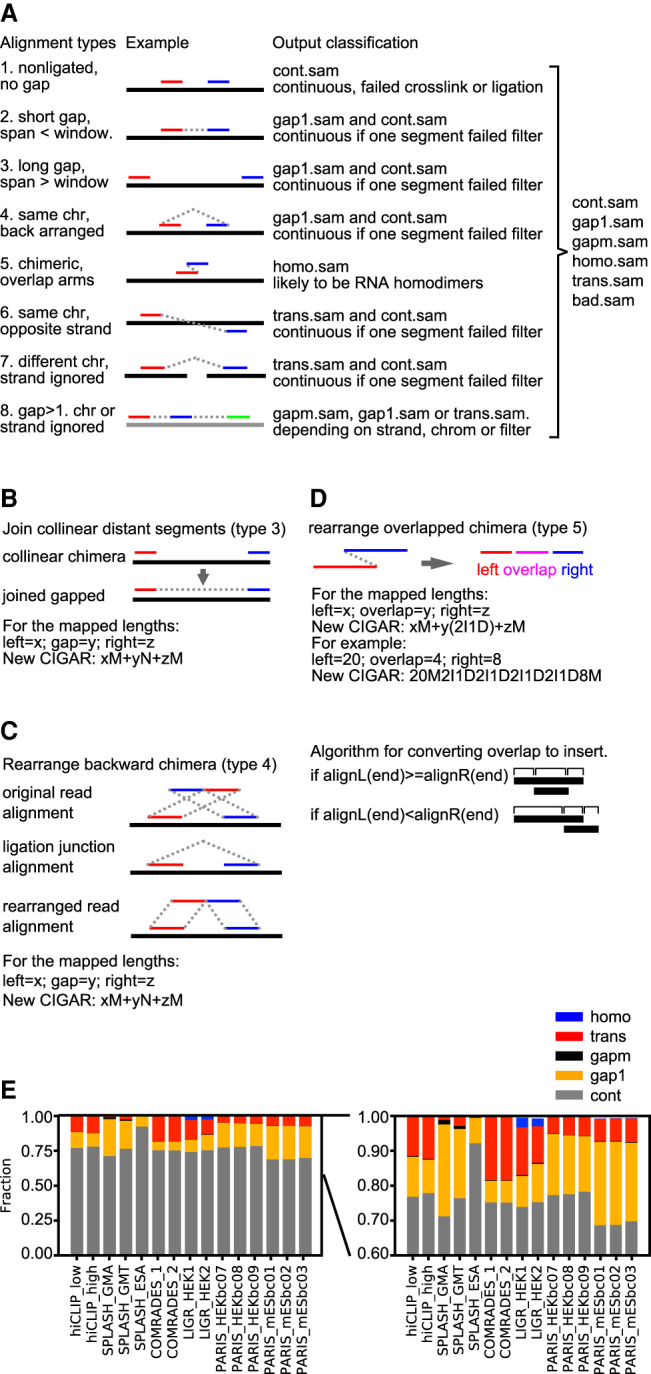
Figure 3.

Classification and processing of alignments from crosslink-ligation experiments. (A) Types of alignments and classification after processing. This diagram presents a unified model for data from all types of crosslink-ligation experiments, and the terms are defined as follows. A read: one piece of sequence from the sequencing machine, and it may have one or multiple alignments to the reference; segment or arm: part of an alignment with no “N” in the CIGAR substring; continuous alignments: type 1, with only one segment or arm, either from non-crosslinked or crosslinked but not ligated RNA; gapped: forward arrangement, with one or more gaps, including gap1 and gapm (types 2 and some of type 8); chimeric: noncontinuous alignments similar to the definition from the STAR method, including types 3–7 and some of type 8; noncontinuous: including both gapped and chimeric alignments; homotypic: chimeric alignments where the arms overlap, suggesting RNA homodimers; trans: segments mapped to different chromosomes or strands (types 6–7 and some of type 8). In SAM files, each record describes one alignment, and it is represented by one CIGAR string. For example, a CIGAR string of “20M25N21M” (M for match, N for gap) has two segments or arms, 20 nt and 21 nt, separated by a 25-nt gap. In type 1, these two segments are from two different reads, and therefore represented by two records in SAM files (two CIGAR strings, e.g., “20M” and “21M”). Type 1 alignments are output to cont.sam. In type 2, these two segments are from the same read and therefore represented by one record in SAM files (one CIGAR string, e.g., “20M25N21M”). This alignment is either output to gap1.sam, or cont.sam if it does not pass the filtering (e.g., the gap corresponds to a splice junction). In type 3, the two segments are from the same read but still represented by two records in SAM files because they are mapped beyond the alignment window in STAR (two CIGAR strings, e.g., “20M” and “21M”). Type 3 alignments are rearranged and output to gap1.sam, or cont.sam if it does not pass the filtering. In type 4, the two segments are from the same read but mapped in reverse order and cannot be represented by one record because reverse order is not allowed in the CIGAR string (therefore represented by two records). Type 4 alignments are rearranged and output to gap1.sam, or cont.sam if it does not pass the filtering. In type 5, the two segments are from one read but overlap each other, which cannot be represented by one CIGAR string and therefore must be represented by two records in SAM files. Type 5 alignments are rearranged and output to homo.sam. In types 6 and 7, the two segments are from the same read but mapped to opposite strands of the same chromosome (type 6) or different chromosomes regardless of strand (type 7), and therefore must be represented by two records in SAM files. Type 6 and 7 alignments are output to trans.sam, or cont.sam if they do not pass filtering. In type 8, the multiple segments are from the same read but are mapped either to the same strand or to different strands or chromosomes. These arrangements are represented either by one record or multiple records in SAM files. Type 8 alignments are rearranged and output to gapm.sam, gap1.sam, or trans.sam, depending on their relative mapping locations. (B) Diagram for joining collinear distant segments into gapped alignments. The two segments are connected so that the two arms are represented by one record in SAM format, where xM and zM are the two arms, and yN is the gap. (C) Diagram for rearranging backward chimeric alignments to normal gapped alignments. The 5′ and 3′ arms are switched so that the two segments can be represented by one record in SAM format, where xM and zM are the two arms, and yN is the gap. (D) Diagram for rearranging overlapped chimera. The two arms are converted to three segments: left overhang, overlap, and right overhang. The new alignment can be represented by one record in SAM format, where y(2I1D) represents the overlapped region. (E) Classification of alignments from previously published crosslink-ligation experiments, in which the low abundance categories are magnified on the right.
