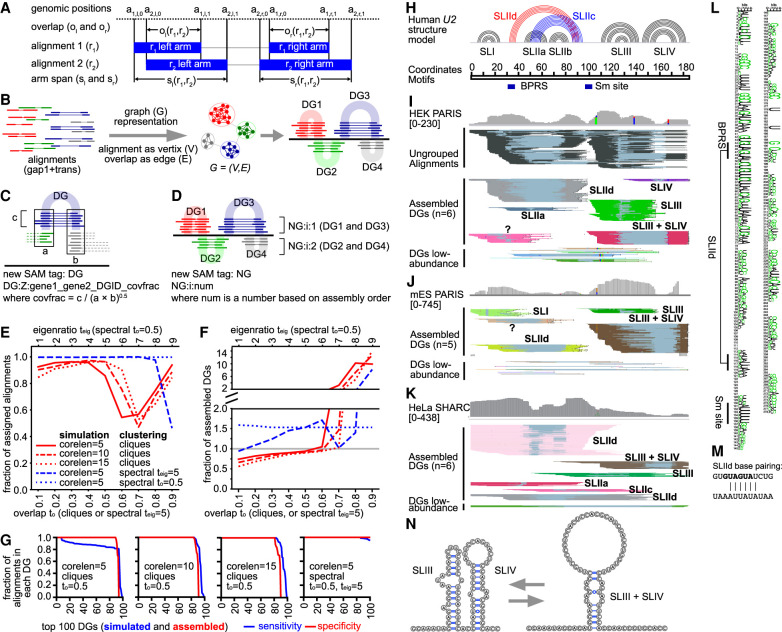
Figure 4.
Network/graph-based method for automatic assembly of duplex groups underlying RNA structures and interactions (CRSSANT). (A) Overlap and span calculation for a pair of alignments. Two alignments r1 and r2 each comprising a left and right arm (solid blue bars), share left and right overlaps ol, or, respectively, and left and right spans sl, sr, respectively. The arm start and stop positions of read/alignment i are represented by the 4-tuple (ai,l,0, ai,l,1, ai,r,0, ai,r,1). The two arms can be on the same chromosome and strand (gap1.sam), or different ones (trans.sam). (B) Diagram for network/graph-based clustering. All alignments with a single gap (gap1 and trans) are represented as a graph where each alignment is a vertex and the relative overlap ratio between the arms is the edge. Highly connected vertices cluster together forming subgraphs, corresponding to individual DGs. (C) Diagram for the DG tag information. The string after DG:Z includes the names of the two genes that the DG connects (gene1 and gene2). gene1 and gene2 are identical when the DG describes intramolecular structures or homodimers. DGID is a number based on assembly order. covfrac (coverage fraction) is defined as the number of alignments in this DG divided by the geometric mean of the coverages at the two arms. (D) Diagram for NG assembly. Non-overlapping DGs (e.g., DG1 and DG3, DG2 and DG4) are combined into NGs for visualization in genome browers like IGV. (E,F) Benchmarking CRSSANT clustering on 100 simulated DGs. All alignments map to Chr 1: 1–1000 and consist of cores 5, 10, or 15 nt (corelen = 5, 10 or 15), and random extensions on each side between 5 and 15 nt. Gaps between the two cores are at least 50 nt and at most the length of the Chr 1: 1–1000. Each DG contains between 10 and 100 alignments. The alignments were clustered using cliques or spectral algorithms. For cliques, overlap threshold to was varied between 0.1 and 0.9. For spectral clustering, to was varied between 0.1 and 0.9 when the eigenratio threshold was set at teig = 5. Alternatively, for spectral clustering, teig was varied between 1 and 10 when to was set at 0.5. The fraction of assigned alignments (out of 5335 input) was plotted in panel E. The fraction of assembled DGs (against 100 input) was plotted in panel F. (G) For each simulated DG data set and clustering parameter combination, the sensitivity and specificity of DG assembly was calculated for each of the top 100 DGs. The sensitivity of DG assembly is defined as the fraction of remaining alignments in each DG after CRSSANT assembly. The specificity is defined as the fraction of alignments from the dominant simulated DG. (H) Human U2 snRNA structure model based on previous studies. (I,J) Human HEK and mouse ES PARIS data were clustered using CRSSANT. The DGs were labeled corresponding to the secondary structure models in panel H. Alignments are grouped in IGV using the NG tag. “?” is a new duplex not in the known structure model. (K) Human HeLa SHARC data were clustered using CRSSANT, and the DGs were labeled as above. (L) The duplex SLIId is conserved from human down to yeast based on multiple sequence alignment of 208 seed sequences (Rfam: RF00004, in WebLogo format). (M) SLIId model; top strand is the 5′ arm, and the bottom is the 3′. Black letters, GUAUGA, indicate the BPRS masked by SLIId. (N) The alternative SLIII + SLIV structure models.

