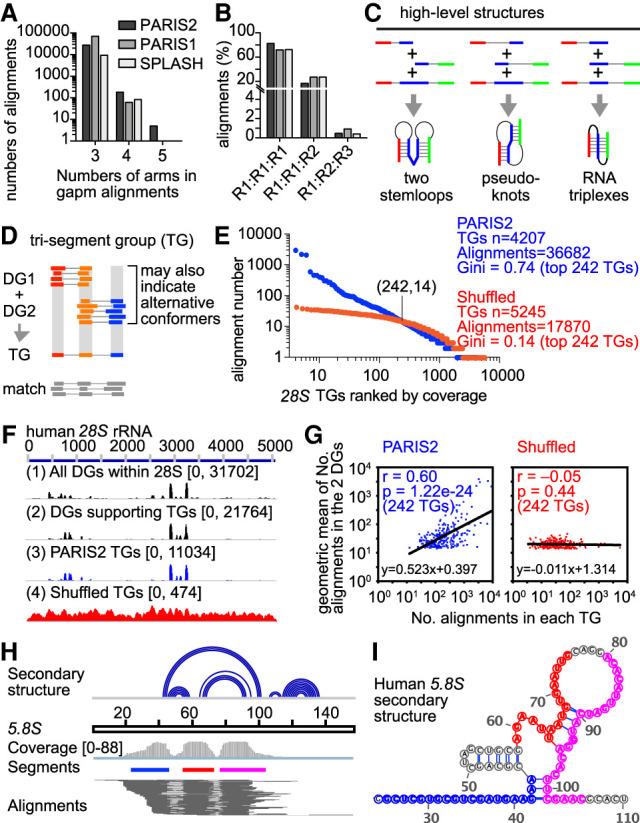
Figure 5.

Multisegment alignments support higher level structures and interactions. (A) Distributions of the numbers of arms/segments in gapm alignments. (B) Numbers of RNAs involved in each gapm alignment. Gapm alignments with three arms are shown. R1, R2, and R3 represent three different RNAs. (C) Gapm alignments with three arms indicate the coexistence of two helical regions. Sequential helices joined by gapm alignments indicate two separate stem–loops (left). Interlocked helices joined by gapm alignments indicate pseudoknots (middle). Overlapping helices joined by gapm alignments indicate triplexes. (D) Strategy to cluster gapm alignments, assuming that all TGs should be combinations of DGs. Alignments with more than two gaps are ignored for now. The DGs were produced by CRSSANT using gap1.sam and trans.sam alignments. The boundaries for each arm are the medians for the DGs. For the TGs, the merged middle arm is the redefined as boundaries of both DGs. Alignments from gapm.sam are then matched to the TGs so that each arm is overlapped. (E) Gapm alignment number distribution for TGs on the human 28S rRNA. PARIS2 HEK293 gapm alignments were assembled directly on the DGs (blue) or shuffled randomly across the 28S rRNA before assembly (red). The shuffling preserves the distances among the segments in each gapm read (i.e., the same CIGAR string). The crossing point (242, 14) indicates that the first 242 TGs each contain at least 14 gapm alignments. (F) Coverage of reads along the 28S rRNA for (1) all DGs, (2) only DGs that support the TGs, (3) TGs from original PARIS2 gapm alignments, and (4) TGs from shuffled gapm alignments. Coverage depth is indicated in the brackets. (G) For the top ranked 242 TGs either from the original gapm alignments (left) or the shuffled gapm alignments (right), the numbers of alignments (x-axis) were plotted against the geometric means of the numbers of alignments in the two DGs that support each TG (y-axis). Alignment numbers are log10-transformed before plotting and calculation of Pearson's correlation. (H) gapm alignments mapped to the human 5.8S rRNA. Top track: base-pairing secondary structure model in arc format. (I) Mapping the three segments to the secondary structure model. The three segments are color-coded in panels H,I.
