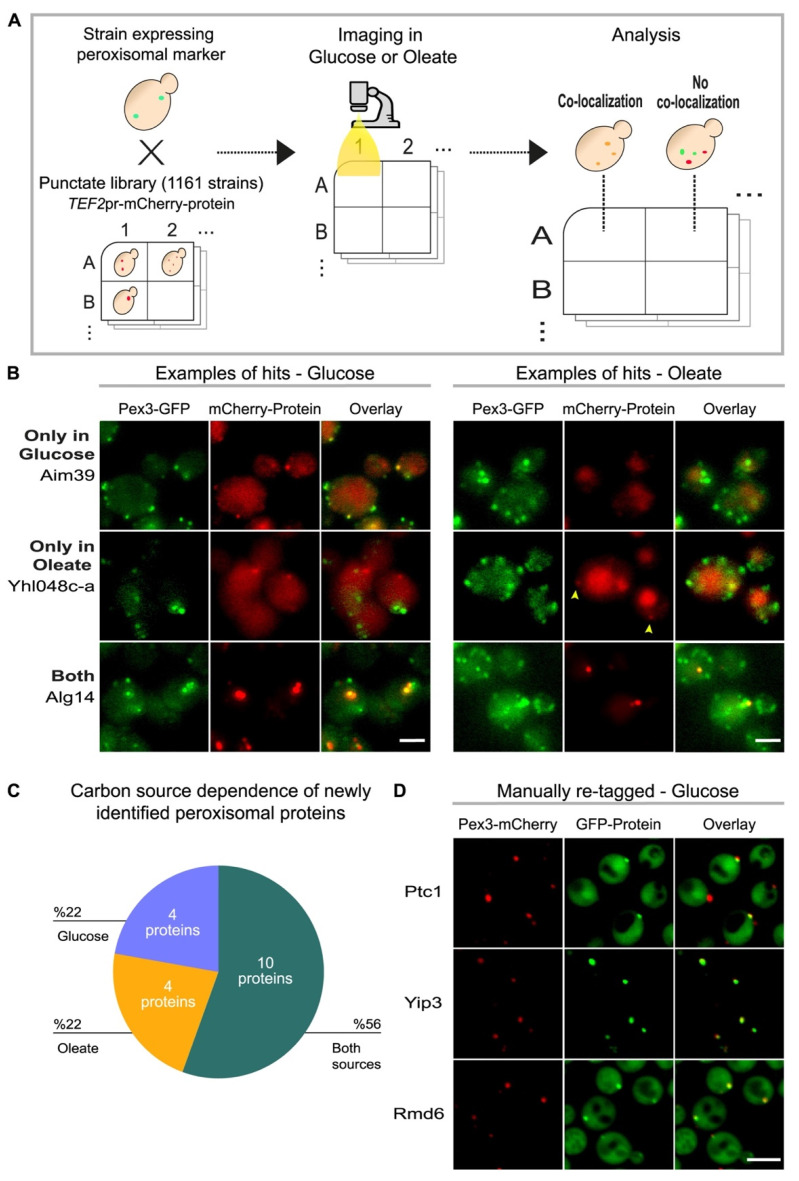
Figure 1.
A high-throughput screen uncovers peroxisomal residents dependent on metabolic status. (A) Schematic illustration of the high-content screen performed to discover low-abundance peroxisomal proteins. A strain (mating type A) with peroxisomal marker (Pex3-GFP) was crossed with a subset of the TEF2pr-mCherry library (mating type alpha), made of 1161 yeast strains in which each strain has a single gene expressed from the strong and constitutive TEF2-promoter and N-terminally tagged with mCherry. The localization of all proteins in this subset had been previously annotated as puncta. Sporulation was induced and haploids containing both traits (the peroxisomal marker and a single protein tagged with mCherry) were selected. Automated imaging of the arrayed collection was performed in medium with either glucose or oleate as carbon sources, and the resulting images were analyzed manually for tagged proteins that co-localized with the peroxisomal marker. (B) Fluorescent images of three examples of proteins that came up in the screen as co-localized with the peroxisomal marker (Pex3-GFP). mCherry-Aim39 is an example of a protein that only co-localized with peroxisomes in glucose and mCherry-Yhl048c-a of those that only co-localized in oleate. mCherry-Alg14 is an example of a protein that co-localized with peroxisomes in both conditions. Scale bar, 5 µm. (C) Pie chart summarizing the newly identified candidate peroxisomal proteins in each condition. (D) Fluorescent images of selected proteins that were further validated by remaking the tagged strains. Ptc1, Yip3 and Rmd6 were expressed from the TEF2-promoter and tagged with GFP. Peroxisomes were visualized by Pex3 tagged with mCherry. All three manually retagged proteins maintained their co-localization with Pex3. Full information on the proteins that came up in the screen and which proteins were validated can be found in Table S2. Scale bar, 5 µm.

