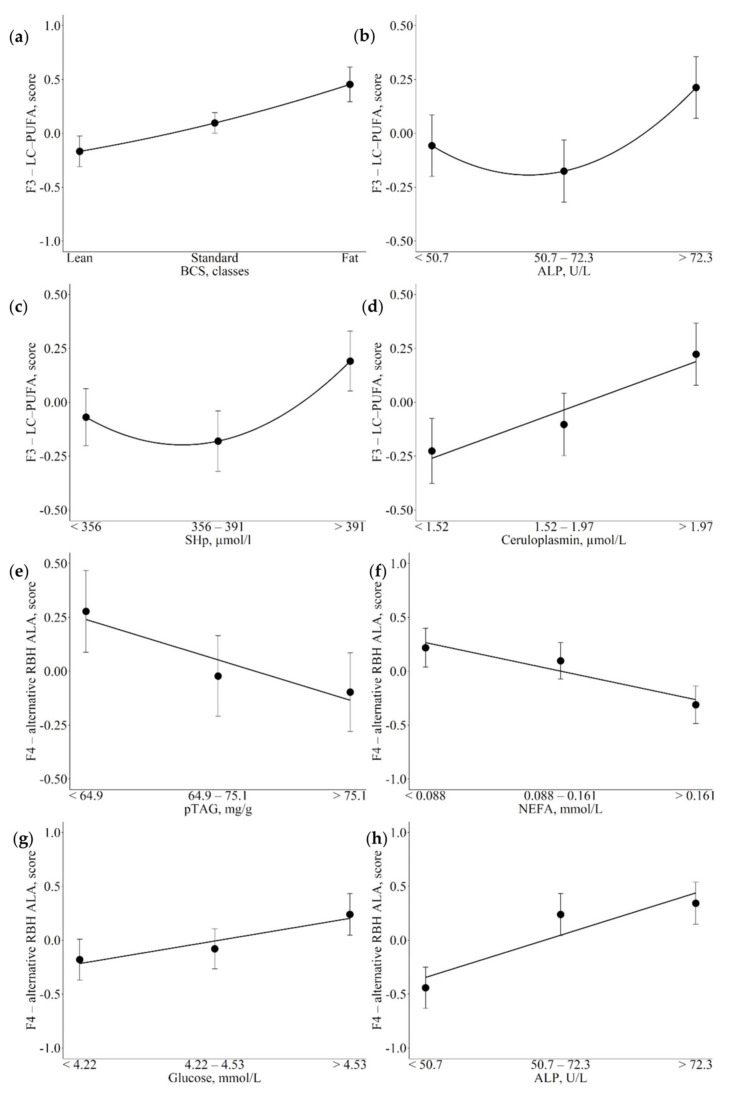
Figure 2.
Least square means (LSM) for F3-long chain—polyunsaturated fatty acids (LC-PUFA; (a–d) and F4-alternative rumen biohydrogenation of α-linolenic acid (alternative RBH ALA) (e–h) across the traits of concern. (a): body condition score (BCS); (b,h): alkaline phosphatase (ALP); (c): total thiol groups (SHp); (d): ceruloplasmin; (e): predicted liver triacylglycerol (pTAG); (f): non-esterified fatty acids (NEFA); (g): glucose. Black dots indicate the LSM and error bars indicate the standard error. Trendlines define linear or quadratic pattern according to polynomial contrast calculations (p < 0.05).

