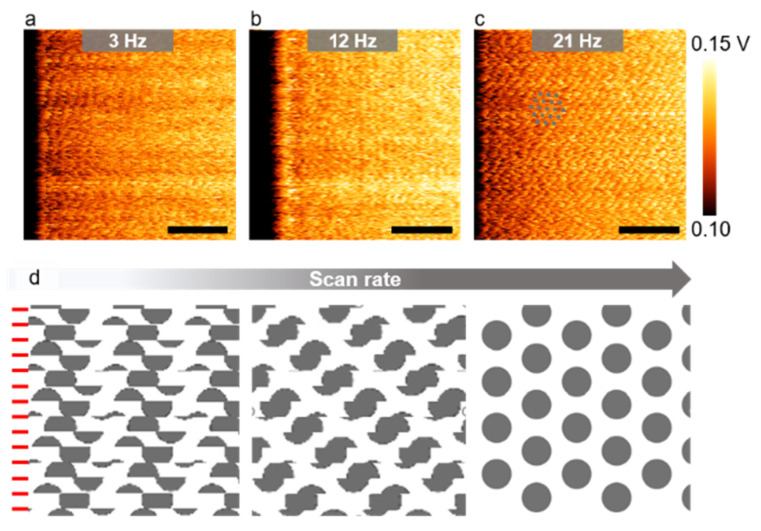
Figure 3.
Scan rate-dependent atomic lattice images (color range adjusted). (a–c) LFM raw images of MoS2 acquired at various scan rates. Grey dots are a guide for the eye and correspond to the centers of the MoS2 hexagons. All scale bars are calibrated and correspond to 2 nm; (d) schematic representations of the LFM images as a function of the scan rate, assuming a constant drift velocity. The red lines mark horizontal scan lines. Image distortion is reduced with an increasing scan rate.

