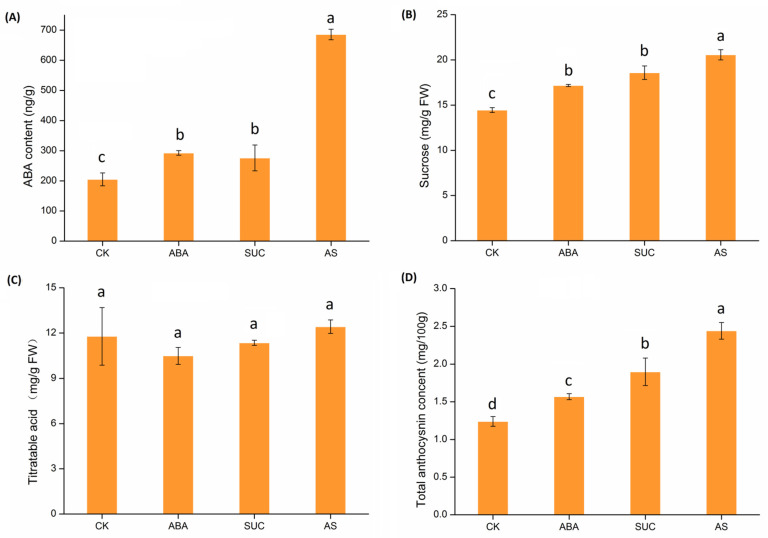
Figure 11.
Effect of exogenous sucrose and ABA on the development of strawberry fruits. (A) ABA content; (B) Sucrose content; (C) Titratable acid content; (D) Total anthocyanin content. CK: control; ABA: abscisic acid; SUC: sucrose; AS: the mixture of abscisic acid and sucrose. Each bar represents the mean ± SD, T-test at the significance level of 0.05 (p < 0.05), different letters (a–d) indicate significant difference, and the same letters indicate insignificant differences.

