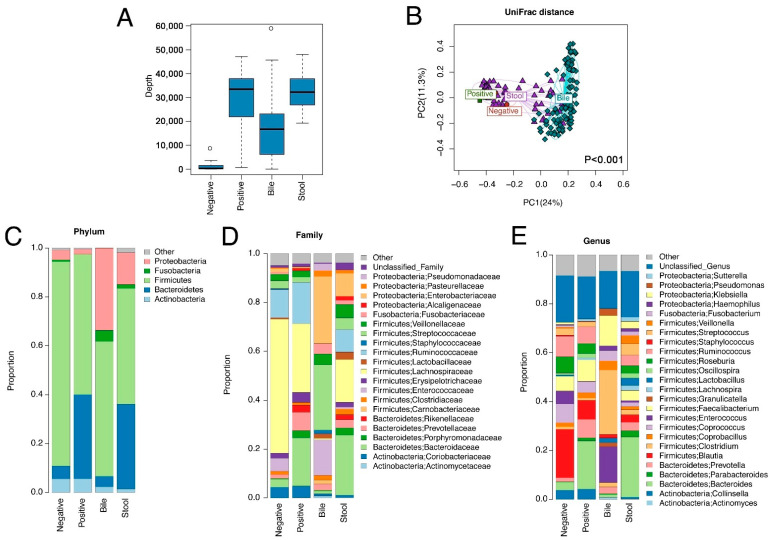
Figure 2.
Microbiome variation across bile, stool, negative and positive controls. The negative controls were empty tubes processed alongside the DNA extractions for the samples, and positive controls were derived from stool samples pooled from 20 healthy subjects. (A) Sequence depth distribution shows that bile samples have a higher sequence depth than negative controls. (B) Ordination plot based on unweighted UniFrac distance reveals a distinct microbiota structure for bile samples. The statistical significance is confirmed by PERMANOVA (p < 0.001, bile vs. other sample types). (C–E) Average microbiota profiles in each sample type show that bile has a unique microbiota profile different from negative controls.

