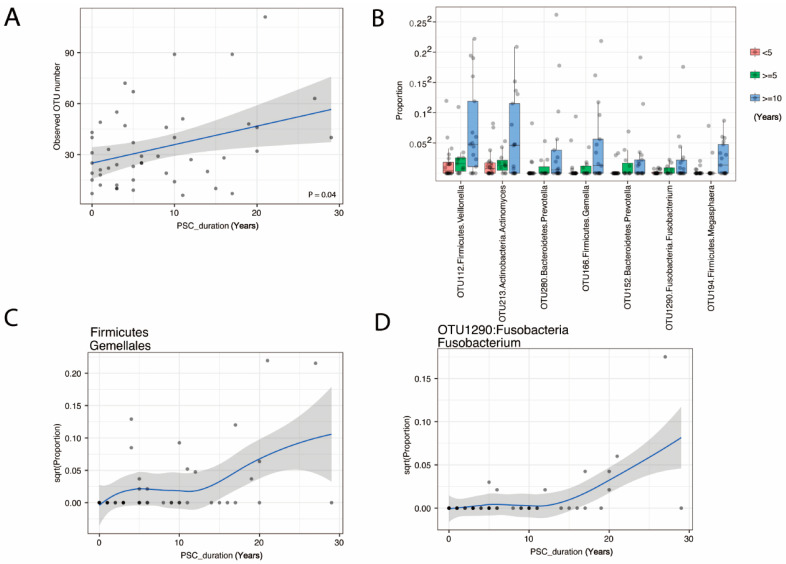
Figure 5.
Changes in bile microbiome with PSC duration in years. Scatter plot of OTU number (A) shows an increase over PSC duration in years. Potential pathogens from 7 OTU (B) and the Order Firmicute; Gemellales (C) increase with PSC duration (FDR < 20%). An example detail from OTU1290:Fusobacteria Fusobacterium is shown in (D).

