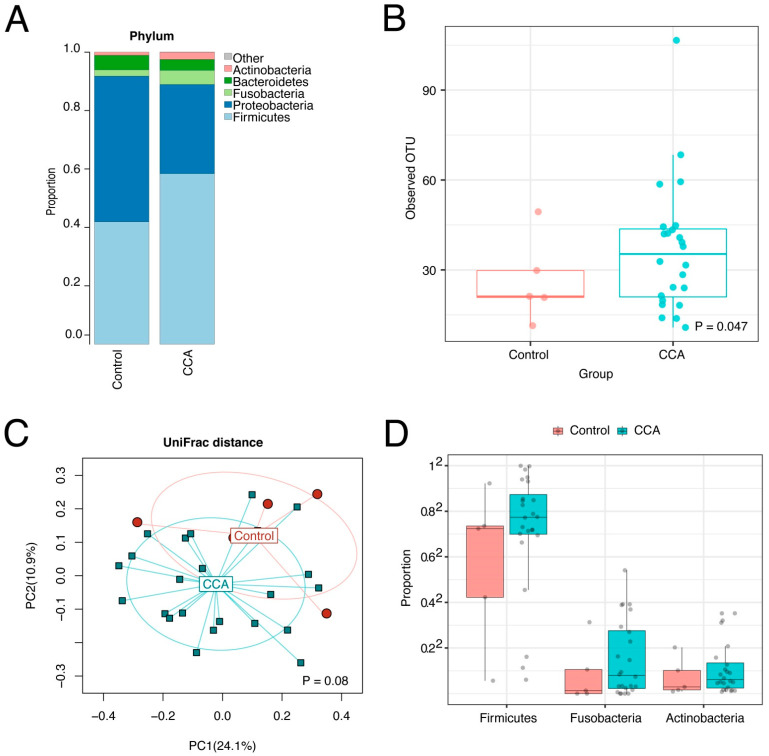
Figure 8.
Bile microbiome profiles of CCA and controls. The bile microbiome profiles (A), the boxplots (B), and ordination plot analyzed by unweighted UniFrac distance (C) of CCA and controls shows species richness in CCA bile samples compared to controls. The bile microbiome boxplots (D) show increases in Firmicutes, Fusobacteria, and Actinobacteria in bile from CCA patients.

