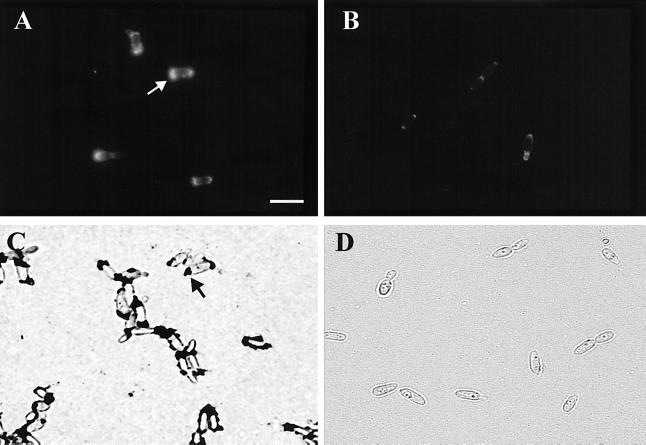
FIG. 3.
FITC-Con A fluorescence staining patterns for R. toruloides Y-1588 cells (A) and Att− mutant IID2 cells (B) and India ink staining patterns (dark blotches) for R. toruloides Y-1588 cells (C) and Att− mutant IID2 cells (D). Note the strongly stained polar regions on the wild-type strain Y-1588 cells obtained with both FITC-Con A and India ink (arrows) and the pronounced reduction in the mutant. Bar = 10 μm.

