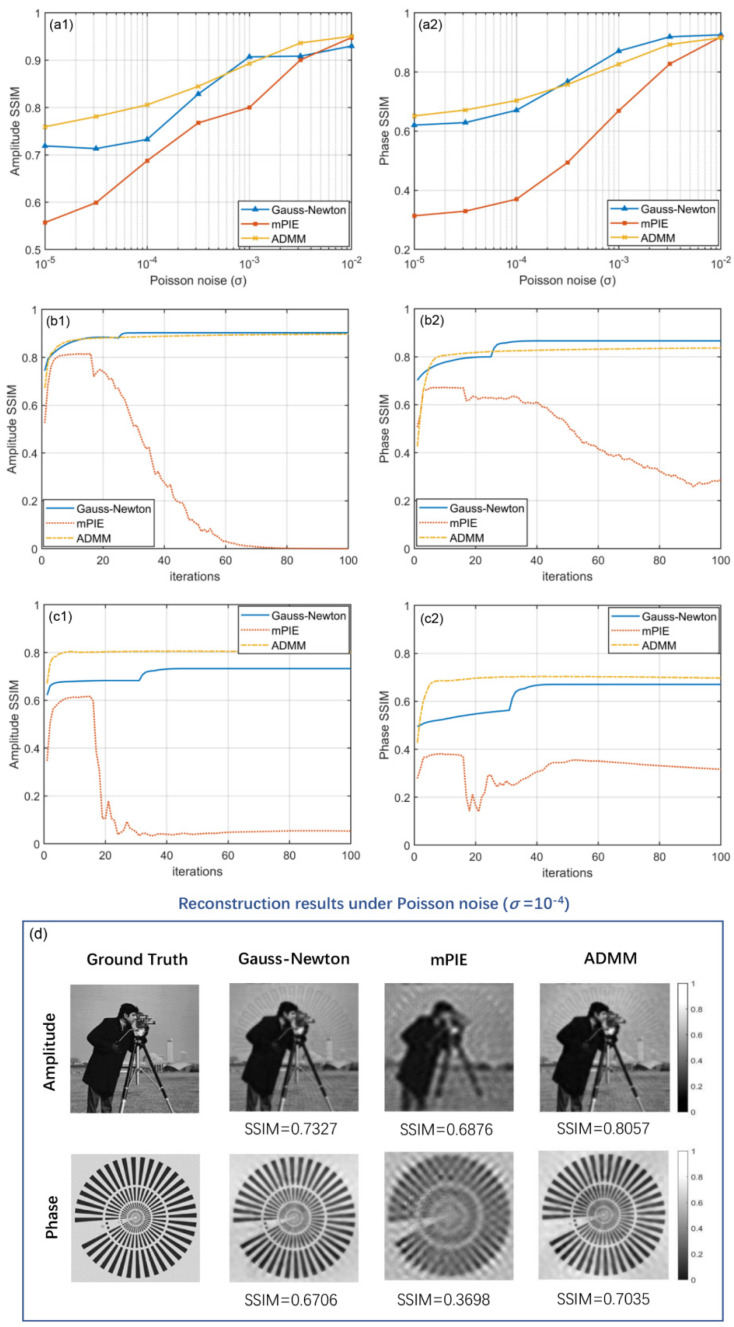
Figure 4.
Comparison of simulated reconstruction results under Poisson noise. (a1,a2) Amplitude and phase SSIM curves as a function of Poisson noise level. (b1,b2) Amplitude and phase SSIM curves as a function of iteration numbers under Poisson noise (σ = 10−3). (c1,c2) Amplitude and phase SSIM curves as a function of iteration numbers under Poisson noise (σ = 10−4). (d) Visual reconstruction results of three algorithms under Poisson noise (σ = 10−4) with SSIM values marked below the images.

