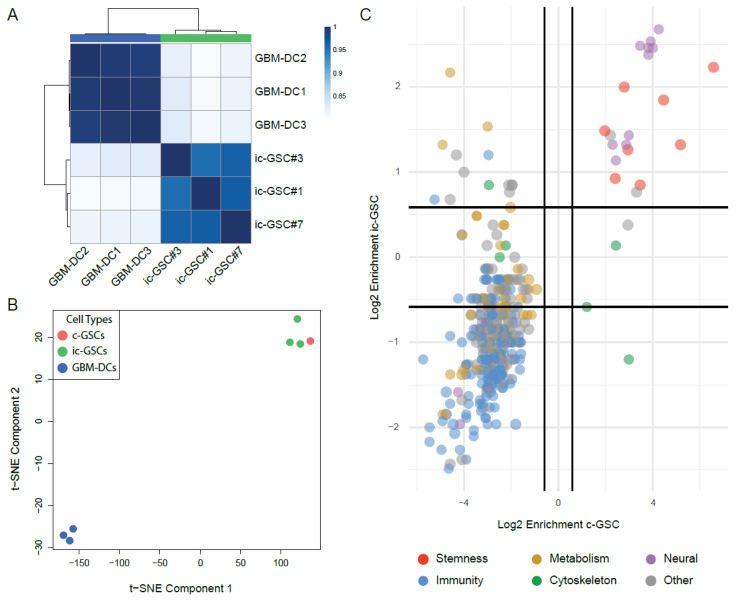
Figure 3.
Transcriptomic analysis of induced core glioma stem cells. (A) Correlation matrix for three GBM-DC replicates and three ic-GSC lines based on gene expression profiles. (B) t-SNE plot of three GBM-DC replicates (blue), three ic-GSC lines (green), and a representative centroid of the c-GSC population (red) using gene expression profiles (C) Scatter plot of enriched pathways in representative ic-GSC and c-GSC populations and colored based on their biological network classification. GBM-DC replicates: GBM-DC1, GBM-DC2, and GBM-DC3; ic-GSC lines: ic-GSC#1, ic-GSC#3, and ic-GSC#7.

