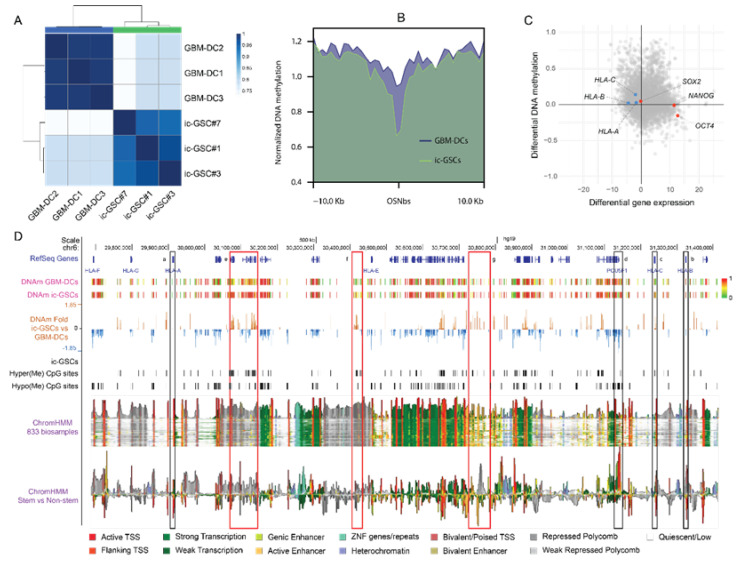
Figure 4.
Epigenomic analysis of induced core glioma stem cells. (A) Correlation matrix for three GBM-DC replicates and three ic-GSC lines based on DNAm profile. (B) Profile plot representing the DNAm levels of GBM-DCs (blue) and ic-GSCs (green) around (±10 kb) consensus OCT4, SOX2, and NANOG binding sites (OSNbs). (C) Starburst plot including DMS (y-axis) and DEG (x-axis) in representative ic-GSC and c-GSC populations, highlighting stem-related factors OCT4, SOX2, and NANOG (red) and immune-associated antigen presentation genes HLA-A, -B, and -C (blue) (D) Representation of a 1.7 Mb genomic region (chr6: 29,685,442–31,426,907) encoding HLA-ABC genes and genes relevant for ic-GSC reprogramming. The view includes RefSeq Genes from NCBI, DNAm levels in GBM-DCs and ic-GSCs, DNAm fold change in ic-GSCs vs. GBM-DCs, hyper- and hypomethylated CpG sites in ic-GSCs, chromatin state (ChromHMM) in 833 biosamples, and chromatin state in stem versus non-stem biospecimens. HLA-ABC and OCT4 (POU5F1) promoter regions are represented as black rectangles. Hypermethylated regions in ic-GSCs are represented as red rectangles.

