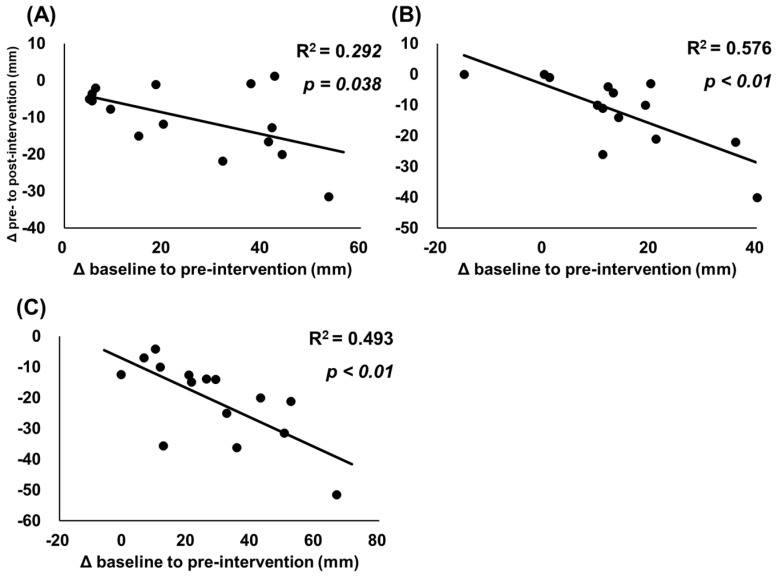
Figure 5.
Relationships between changes in muscle soreness. Data presented as individual data points with R2 and p values. The figure shows relationships between changes from baseline to pre-intervention and from pre-intervention to post-intervention in muscle soreness for muscle contraction (A), stretching (B), and palpation (C).

