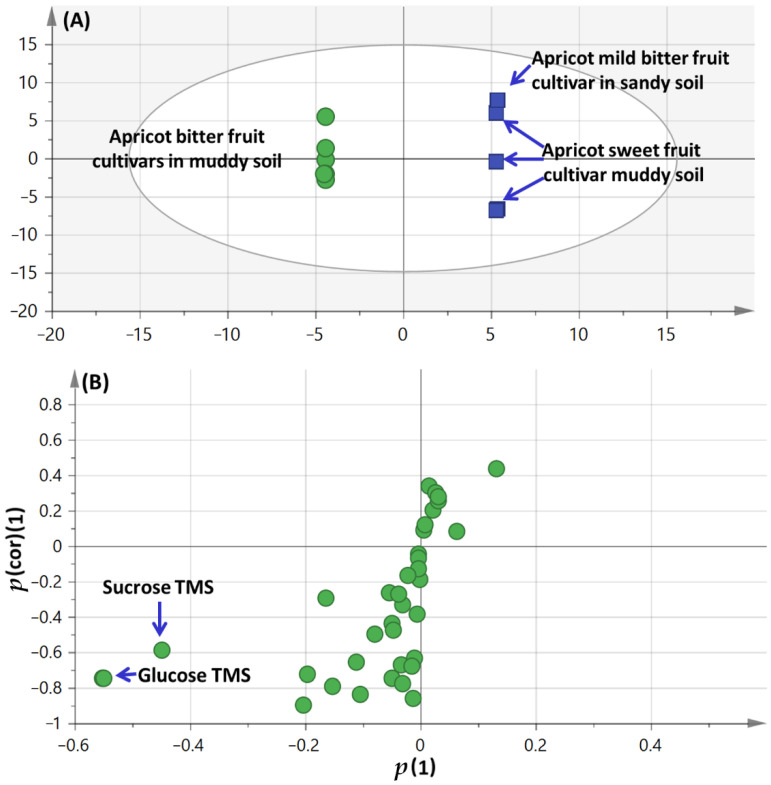
Figure 3.
GC–MS-based OPLS-DA score plot (A) derived from modeling silylated primary metabolites of apricot fruit cultivar grown in sandy versus muddy soil (n = 3). The respective loading S-plots (B) showing the covariance p (1) against the correlation p(cor) (1) of the variables of the discriminating component of the OPLS-DA model. Cut-off values of p = 0.32 was used. Designated variables are highlighted and identifications are discussed in the text.

