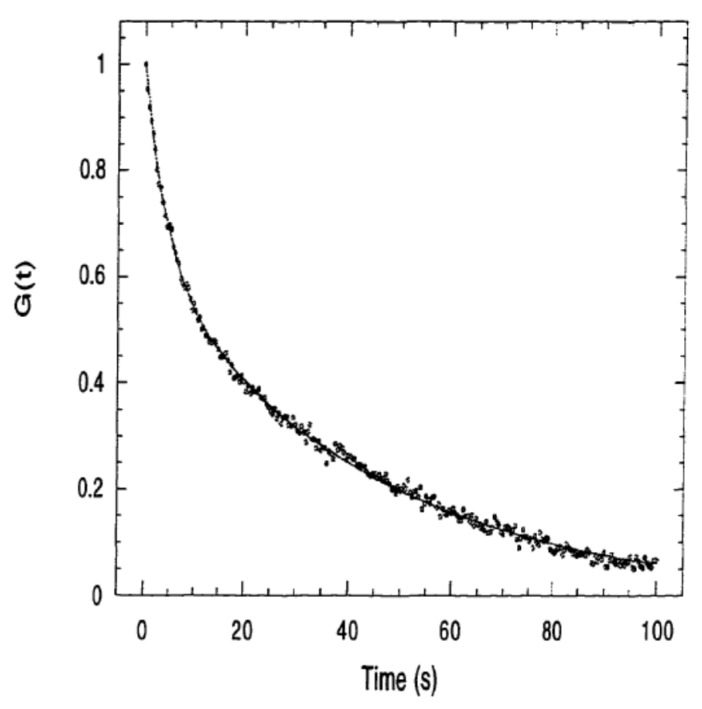
Figure 6.
A conventional TIR/FRAP recovery curve (F(t) vs. time) of fluorescently tagged DNA in PBS on amino-coated glass which was fitted with two adsorption state model (extended version of Equation (49)). Reprinted/adapted with permission from [96]. Copyright 1997, Vincent Chan.

