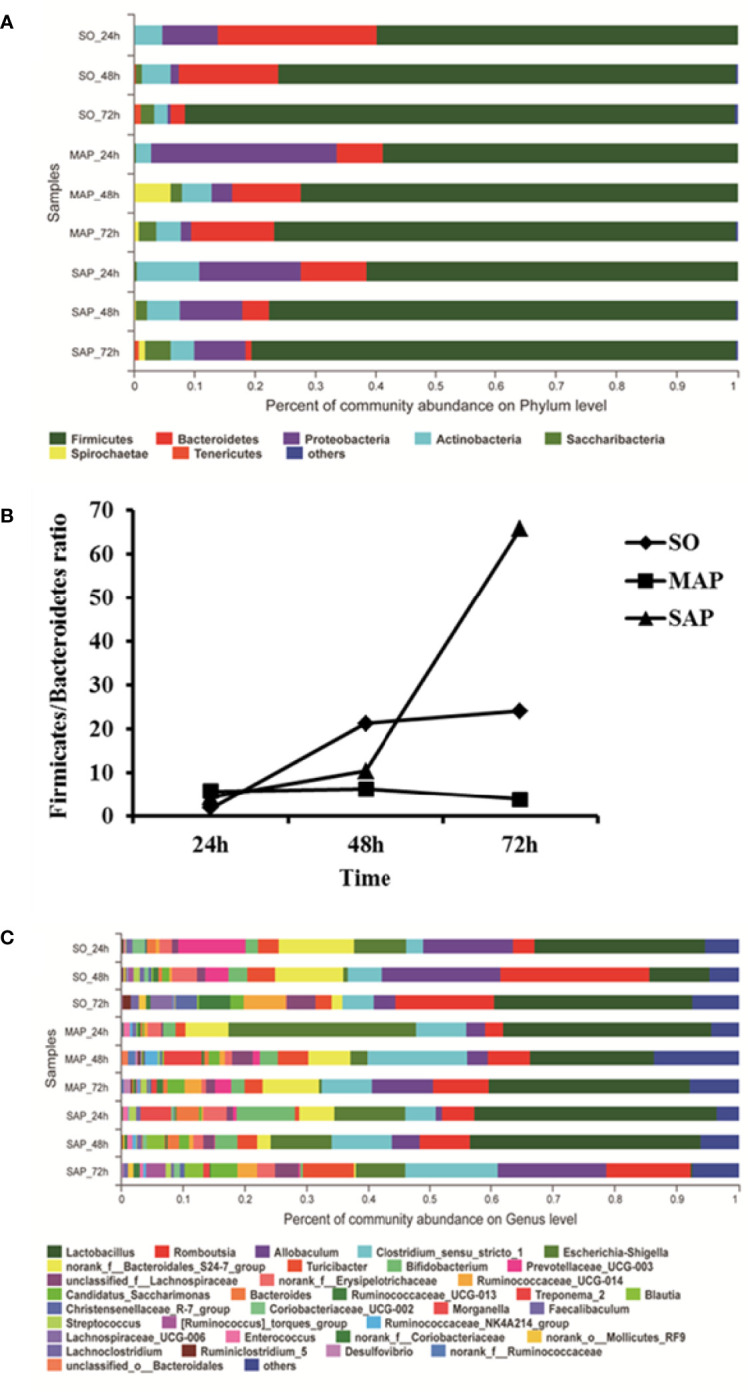
Figure 2.

Microbial community composition in fecal samples taken at three time points. (A) For each sample, the bar width of each phylum indicates the relative abundance of that phylum in the sample. (B) The Firmicutes/Bacteroidetes ratio of the three groups. (C) For each sample, the bar width of each genus indicates the relative abundance of that genus in the sample. SO, Sham operation; MAP, Mild acute pancreatitis; SAP, Severe acute pancreatitis.
