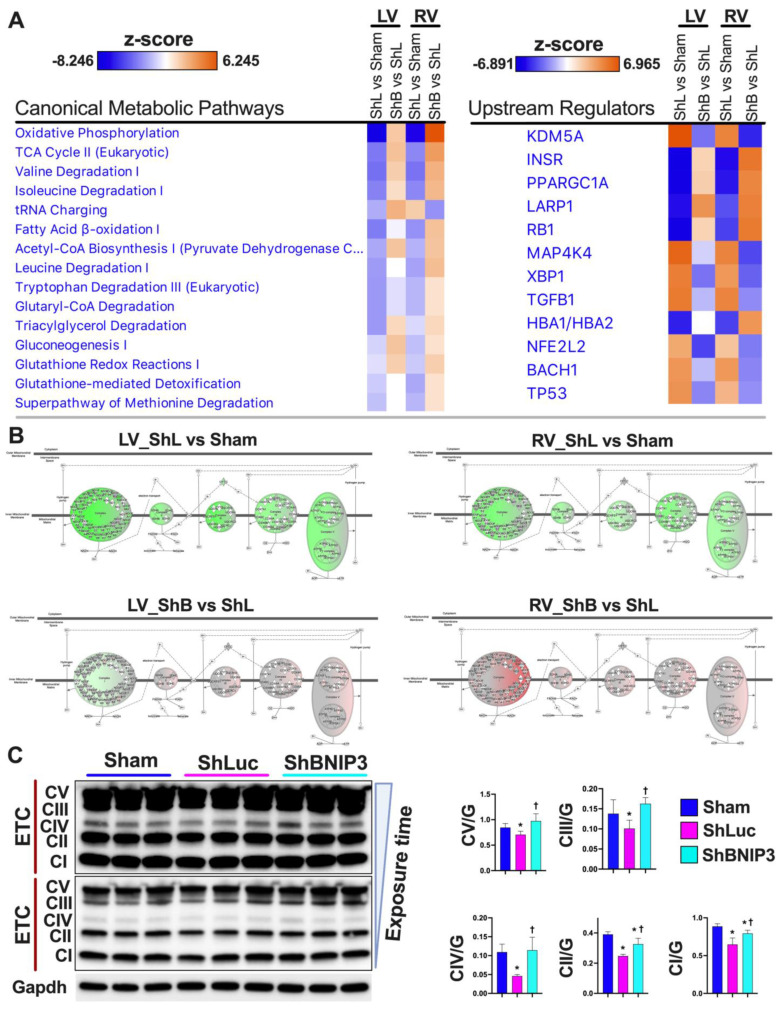
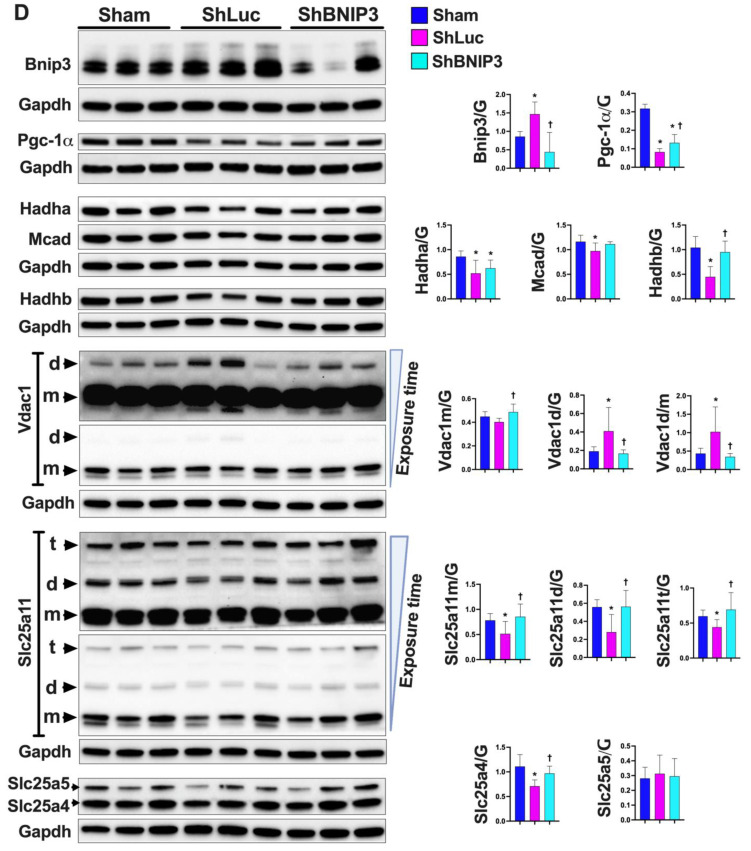
Figure 2.
Validation of the LV and RV proteomic findings. (A). “Core Analyses” was performed in IPA for each of the two-group comparisons, i.e., ShLuc vs. Sham and ShBNIP3 vs. ShLuc, with a cutoff p-value < 0.05. Analyzed datasets were then compared with each other in IPA’s “Comparison Analyses” function to yield the most enriched Canonical Metabolic Pathways (left) and Upstream Regulators (right) that were shared among the two-group comparisons. The respective z-score-based heat maps indicate shared Canonical Pathways and Upstream Regulators that were upregulated/activated or downregulated/inhibited in the two-group comparisons, with orange and blue color intensities representing the z-score-based extent of upregulation/activation or downregulation/inhibition, respectively. (B). Oxidative phosphorylation (OXPHOS) network of the electron transport chain (ETC) complexes I–V transport system presented in ShLuc vs. Sham (upper panel) and ShBNIP3 vs. ShLuc (lower panel) in LV (left) and RV (right) proteomic datasets. The network highlights mt-OXPHOS proteins in each ETC complex that were downregulated (green) or upregulated (red) or were unchanged (grey) within the two-group comparisons, and those that were not identified (white) in the LV and RV proteomic datasets. The darker the green or red color, the higher the degree of decrease or increase in relative expression, respectively. (C,D). Expression of the ETC complexes I–V, BNIP3, and molecular markers involved in mt-biogenesis and metabolism by western blot, * p < 0.05 vs. Sham and † p < 0.05 vs. ShLuc. Abbreviations: ShL, ShLuc; ShB, ShBNIP3.


