Figure 4.
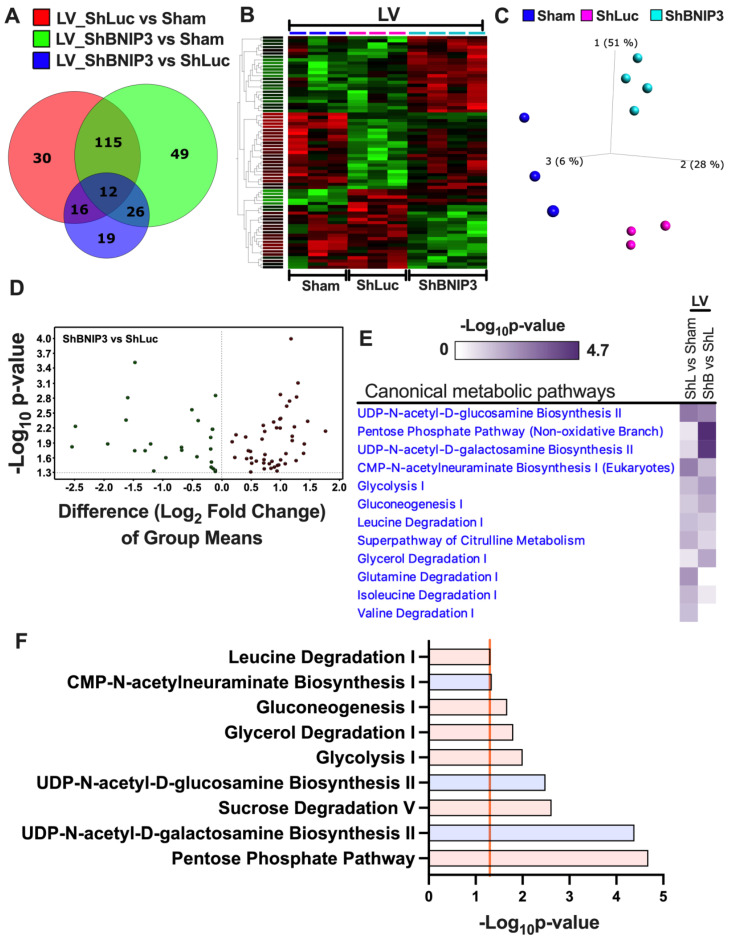
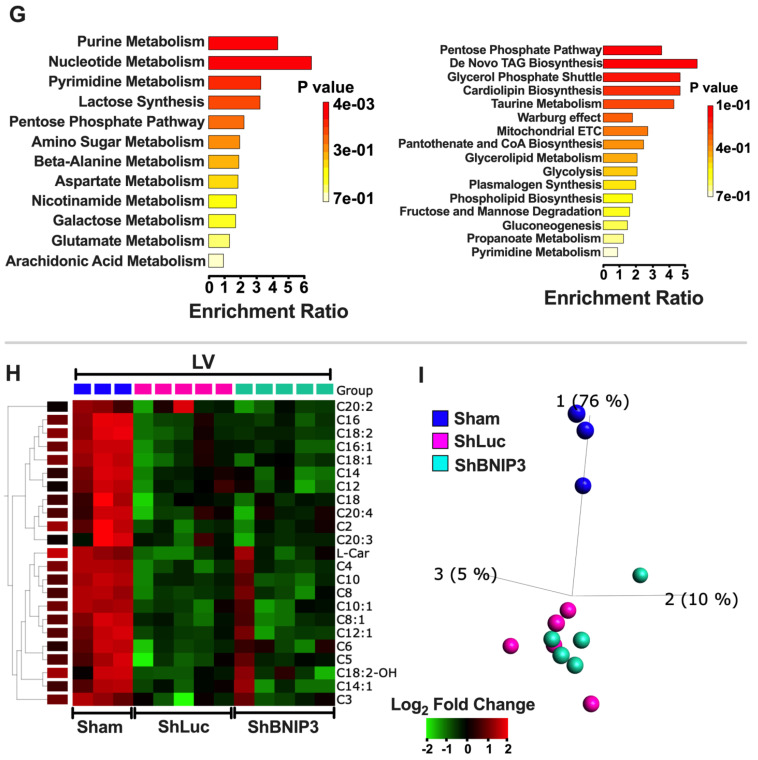
Visualization and validation of the differentially expressed metabolites in ShBNIP3 vs. ShLuc groups in the LV myocardium untargeted metabolomic dataset. (A). Venn diagrams show the number of metabolites that were differentially abundant in ShLuc vs. Sham (red), ShBNIP3 vs. Sham (green), and ShBNIP3 vs. ShLuc (blue). (B,C). Heat maps and PCA plots show the relative log2-fold expression and the variance in biological samples, respectively, in Sham, ShLuc, and ShBNIP3 groups of the differentially abundant metabolites in ShBNIP3 vs. ShLuc groups. (D). Volcano plot shows the log2-fold change in group means for the metabolites whose abundance increased (red) or decreased (green) in the ShBNIP3 vs. ShLuc groups, taking a cutoff −Log10 p-value of 1.3 (p < 0.05). (E). Heat maps show the most enriched Metabolic Pathways by the −Log10 p-value of the untargeted metabolomics dataset. The heat maps were generated in IPA after “Core Analyses” of each of the two-group comparisons, which were then compared with each other in IPA’s “Comparison Analyses” function. (F). Metabolic pathways that were predicted to be enhanced (orange bar) or attenuated (blue bar) in shBNIP3 vs. ShLuc, taking a cutoff −Log10 p-value of 1.3 (orange line). (G). Enrichment pathway analysis of the metabolites that were differentially downregulated (left) or upregulated (right) in ShBNIP3 vs. ShLuc. Data were generated in MetaboAnalyst 5.0 bioinformatics software using the “Enrichment Analysis” function. (H,I). Heat maps and PCA plots show the relative log2-fold expression and the variance in biological samples, respectively, in Sham, ShLuc, and ShBNIP3 groups of the differentially abundant acyl-carnitines in ShBNIP3 and ShLuc groups vs. Sham.


